
What Does High Volume but Low OI Mean? A Cross-Analysis of Tokenized Stock Exchange Activity
Author: Flowie|ChainCatcher content author, focusing on RWA, interpreting the true narrative of Web3.
When looking at a tokenized stock exchange’s high 24-hour trading volume and low open interest (OI), the easiest conclusion to draw is often “very active.” But this judgment goes too fast: the former records transactions that have been completed within a period of time, while the latter records contracts that are still on the market at a certain point in time. Their different scales first illustrate the different time dimensions, not which platform is necessarily better.
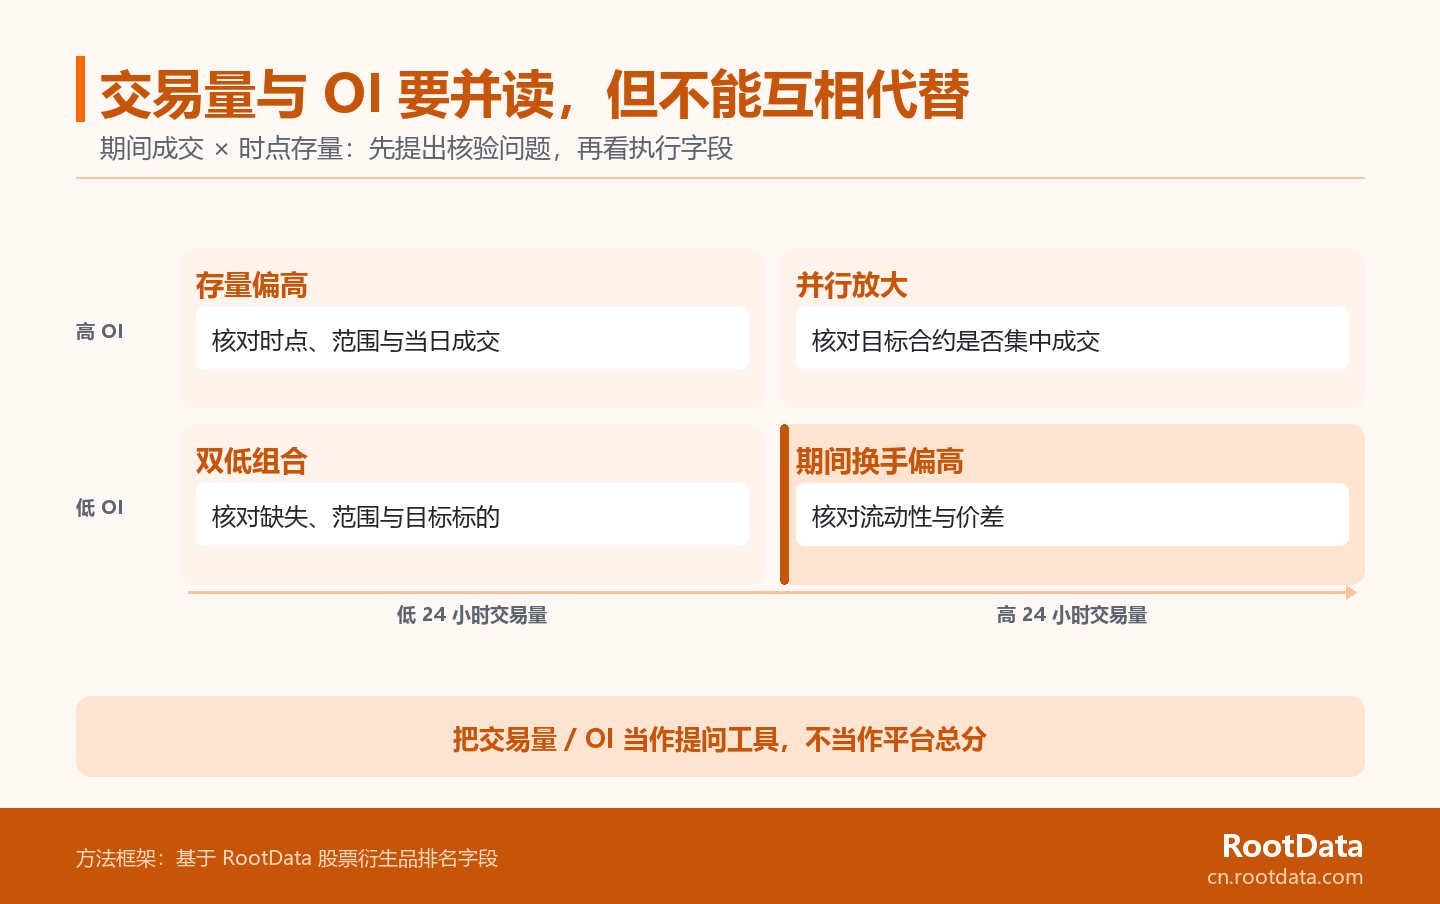
For researchers, a more useful way to read this group of combinations is as a question: Why are current transactions more active than existing positions? The answer may be related to the short-term turnover, market period, target or product range; whether the order book is thick enough and the quotation is tight enough still needs to be verified by going back to the liquidity and spread fields.
The first indication of high trading volume and low OI is that "the transactions during the period and the stock at the time are not amplified simultaneously", not "this exchange is more suitable for trading".
This interleaved reading is illustrated below using a frozen snapshot of RootData at 17:30 on July 23, 2026. All expressions involving platform numbers are limited to this point in time; fields not shown are left as missing and are not filled with zeros.

When you see high volume and low OI, grab these three things first
- First divide the caliber. 24-hour trading volume is the turnover within a window; OI is the size of open interest at a point in time. The two are not the same "activity report card".
- Look at comparability. Only when the time point, unit and product range are consistent, division or side-by-side comparison can be discussed; missing values cannot be written as zero.
- Finally, look at the execution conditions. No matter what the volume/OI mix looks like, liquidity, spreads, and target stock contracts all need to be reviewed individually.
First of all, let’s make a distinction: trading volume is the transaction volume during the period, and OI is the inventory at the point in time
24-hour trading volume records completed transactions within a period, and open interest (OI) records the size of the contract that has not yet been closed at a certain point in time; they can be read together and cannot replace each other.
This difference explains why the two numbers move in different directions. In a certain time window, participants can frequently open, close, or change hands, causing transactions to accumulate quickly; by the time of the snapshot, the size of the contracts remaining on the market may not increase simultaneously. In turn, a higher OI only shows that there are still more open contracts at that point in time, and cannot replace how many transactions have been completed that day.
Therefore, trading volume is more suitable to answer "how many transactions occurred during this period", and OI is more suitable to answer "how many contracts are still open at this moment". If the former is directly referred to as depth, or the latter is directly referred to as transaction popularity, the intermediate execution conditions will be skipped: the distance between the buying and selling quotes, that is, the spread, and the liquidity displayed on the page.
Lock the same snapshot first before talking about cross analysis
RootData's frozen snapshot at 17:30 on 2026-07-23 covers 29 platforms. This article only discusses 24-hour transaction volume and OI under the same snapshot and the same dollar caliber. RootData's stock derivatives trading platform page displays these two fields at the same time, as well as information such as liquidity, spread, number of contracts, and rates for subsequent review.
The -- or undisplayed status in the snapshot should be retained as missing and cannot be rewritten to zero before participating in the comparison. The original field status of the snapshot is the basis for not padding zeros in this article. In other words, a seemingly accurate ratio should not be calculated in the absence of OI or volume; such "zero padding" would misrepresent data availability as market fact.
This article also does not use OI or volume assist percentages whose meaning is not explained separately on the page. For the same snapshot, the most reliable smallest unit of comparison is: platform name, observation time, 24-hour trading volume, OI, liquidity, spread, and the stock contract that the reader really cares about. RootData's data standard emphasizes the verifiability of data sources, cleaning and standardization; for table readers, this means preserving the original appearance of the fields before interpreting them.
Trading volume / OI is an observation tool, not the total activity score
Dividing the 24-hour trading volume of the same snapshot by OI can only form an auxiliary observation about the relative time-point stock of transactions during the period. It is not an official indicator of RootData, nor is it the total platform activity score.
This division is valuable because it turns the "two big numbers" into a clearer question: what is the relationship between the accumulated transactions over a period of time relative to the size of the open positions at the snapshot. Where it has no value is equally clear: it cannot show the depth of each order, the structure of buyers and sellers, the continuous quotes of an underlying, or the direction of the trader.
Regardless of which combination of volume and OI falls, liquidity and spread should be reviewed as independent execution conditions and not replaced by derived values. For tokenized stock exchanges, in particular, the overall fields of the platform cannot be directly extrapolated to a certain stock contract; first confirm whether the target contract is within the range, and then determine whether it has sufficient observable trading conditions during that period.
RootData's Stock Derivatives Ranking Notes lists considerations beyond volume and OI, also includes order book depth, spreads, rates, funding rates, contract coverage and data availability. This multi-field structure is why this article does not write a derived value as the conclusion.
High transaction volume, low OI: check handover and execution conditions first
High trading volume and low OI can indicate that transactions during this period are more active than the stock at that time, but it cannot independently prove that the depth is good, the risk is low, or it is more suitable for trading.
The most worthy question about this combination is not "who is trading", but "which contracts are concentrated in and at what quotations". If the liquidity field is low or the spread is wide, higher period transactions do not automatically mean that the target the reader cares about can be traded under the same conditions. On the contrary, if the liquidity and spread of the target contract can also be observed, then there is reason to continue to study whether this activity has execution significance.
High OI, low trading volume: do not read existing positions as daily transactions
The relatively high OI and low trading volume indicate that the stock at that time and the transaction volume of the day are not amplified simultaneously, and the position direction, stability or trading experience cannot be judged based on this.
The function of this direction is to put a brake on the previous judgment. A lower derived value does not mean there is a lack of market, nor does it mean that the position is safer; it only reminds readers that the day's transactions and the time point stock may be at a different rhythm. Next, you should still confirm whether the two fields cover the same type of stock contract, whether the update time is consistent, and check the quotation conditions of the target.
Two examples of the same snapshot: how to read the numerical difference
In this snapshot, Bybit shows a 24-hour trading volume of $896.59M and an OI of $97.48M. The division between the two is approximately 9.20. The raw fields of this snapshot make this arithmetic recalculable, but 9.20 is not an official turnover rate, nor does it mean Bybit is better for all readers or all stock contracts.
In the same snapshot, Bitunix showed a 24-hour trading volume of $423.8M and an OI of $1.57B. The division between the two is approximately 0.27. Bitunix fields from the same snapshot can be used to recalculate this value. This lower display multiple is also not a quality label; it only illustrates together with the previous example: period transactions and time-point stocks can be significantly different, and one of the numbers alone cannot answer the true transaction quality.
| The same snapshot field | Bybit | Bitunix | How to understand |
|---|---|---|---|
| 24-hour trading volume | $896.59M | $423.8M | These are all completed transactions within the window |
| OI | $97.48M | $1.57B | These are the open interest sizes at the snapshot time |
| Trading volume / OI | About 9.20 | About 0.27 | It is only a relative observation and does not constitute an official score |
The significance of this set of comparisons is not to select a platform for readers, but to preserve the correct order of research: first save the original numbers and time points, then ask where the difference in numbers comes from, and finally use liquidity, spreads and target contracts to narrow this problem. By saving only a derived ratio, the most important reviewable condition is lost.
Turn cross analysis into a three-step review instead of a ratio
First check the time and unit, then read the trading volume, OI, liquidity and spread, and finally return to the target stock contract; this sequence can avoid misreading the overall platform field into a single contract conclusion.
- Fixed observation point. Record the page update time and confirm whether the transaction volume and OI are from the same snapshot and the same dollar caliber; values on different dates should not be divided directly.
- Reserve four fields. In addition to volume and OI, also note liquidity and spreads. The first two allow you to see the relationship between transaction and stock, and the latter two help you judge whether the quotation and transaction conditions are worthy of further study.
- Return to the target contract. First confirm whether the stock contract of interest is included, and then check whether the underlying instrument still has observable data in the new snapshot. Do not use the overall platform number to replace the judgment of a single contract.
When you need to review, you can directly View RootData stock trading platform ranking, and recheck the timestamp, complete fields and target platform on the updated page. The link here is for review entry, not for transaction or account opening guidance.
Four things this set of indicators can’t answer for you
Neither trading volume, OI nor the derived observations in this article constitute investment advice, nor can they replace product rules, regional access or risk judgment. RootData's Stock Derivatives Ranking Notes and Disclaimer both clarify this multi-field, non-recommended boundary.
- Tradability of single stock contracts. The platform's overall data does not guarantee that a certain target will have the same depth and price during the period you are paying attention to.
- Product structure and rights. Tokenized stocks, stock perpetual contracts and other price exposure products have different structures and need to be independently verified according to the page rules and applicable regions.
- Access and Compliance Conditions. Regional access, account eligibility and product availability are not determined by trading volume or OI.
- Risk and suitability. Leverage, funding rates, price volatility, and personal risk tolerance are outside these two fields. RootData's exchange ranking method description also emphasizes multi-dimensional comparisons, rather than just judging based on transaction volume.
FAQ
The correct usage of trading volume and OI is to generate next review questions, rather than rewriting any value into an unconditional platform selection conclusion.
Can high trading volume and low OI be directly judged as excessive short-term trading?
It cannot be judged directly, but it can prompt readers to further check the changes in hands, liquidity and price difference during this period. High trading volume may come from multiple openings and closings of positions, or it may be concentrated in a few targets or specific time periods; without order-level data and target contract data, this combination cannot be interpreted to mean that there must be more traders of a certain type, let alone trading experience.
Can trading volume and OI be divided and directly compared between platforms?
You can use it as an auxiliary observation under a snapshot of the same caliber, but you cannot use it as an official score or an absolute ranking across time. Before comparison, at least confirm that the time, currency caliber, and product range of the two fields are consistent; after comparison, the original trading volume, OI, liquidity, and spread must be retained. This way the reader knows what the ratio describes, rather than just being left with a number taken out of context.
What should I look at first when OI is high and trading volume is low?
First confirm whether OI and trading volume come from the same time point and the same product range, and then check the spread, liquidity and target contract. A higher OI only shows that the stock is larger at that point in time, and a lower trading volume only shows that there are fewer transactions in that window; both cannot infer the long-short direction, market stability, or that a certain stock contract must be easy to trade. If necessary, fields should be rechecked on the update page.
Can it be treated as zero when encountering OI or missing transaction volume?
No, missing values only mean that the snapshot is not displayed or is temporarily unavailable, and cannot be overwritten to zero. Including missing values in division can create falsely high, low, or infinite results, and can also mask inherent limitations in data availability. The safest approach is to leave the missing state in and narrow the comparison to only those platforms where both fields are present.