
Stock Perpetual Open Interest (OI) Ranking: What Does Position Size Reflect?
Let me draw the conclusion first: OI is a clue to the position size, not a conclusion to the trading ability
Open interest (OI) is the total amount of contracts that have not been closed at a point in time; the OI ranking reflects the size of the contracts that still exist at the exchange level and cannot alone prove the trading capacity, liquidity or direction. It is more accurate to read it as "How many open stock perpetual contracts are there on the exchange" than "Which exchange is the best trading place right now". This article uses snapshots of 29 platforms at the same time. It first gives the order, and then explains what layers of information are missing before entering into single contract research.
High OI can indicate that there is still a large existing contract size in the stock perpetual contract market of a certain platform; this is worthy of further research, but it is not a platform recommendation, let alone proof of execution conditions. To judge whether a certain transaction can be completed smoothly at a certain point in time, one must go back to the real-time bid and offer quotes, spreads and visible orders of the specific target.
- OI Answer: How many open contracts remain in the market at a given point in time.
- OI does not answer: How many orders can a certain contract currently accept, what is the transaction cost, or whether the market is net long or net short.
- Table reading sequence: First fix the snapshot, then check the trading volume and liquidity fields, and finally enter the real-time page of the same stock perpetual contract.
What does OI record: the stock of outstanding contracts, not the transactions of the day
Open interest is the total amount of contracts that have not yet been hedged, delivered, exercised or settled by a transaction. CFTC Notes on OI and BIS's terminology explanation limits it to contracts that have not yet been settled or closed, rather than all transactions that have occurred within a certain period of time.
At the aggregate level, open longs equal open shorts, so aggregate OI cannot alone give a net long-short direction. CFTC The same statementlimits the pairing relationship of the total contract volume; it does not tell us who the position holders are, what the point of view of a certain party is, or how the price of a certain platform will change next.
24-hour trading volume refers to the number or amount of contracts that have been traded during a specified 24-hour period, which is different from OI at a certain point in time. Therefore, rising, falling or absolute values of OI should be treated as a market structure clue to be cross-validated. It can help researchers identify platforms and contracts worth continuing to look at, but it cannot alone carry conclusions about direction, liquidity or trading recommendations.
OI snapshots of 29 exchanges and related platforms
RootData Equity Derivatives Ranking Page is the data source for this table. The table below reorders 29 platforms by OI as shown by RootData on 2026-07-23 17:30, retaining the original "--" of MSX. This is a frozen snapshot: sorting is used to compare field displays at that time and does not represent real-time OI, nor does it constitute a judgment on the merits of a platform or product.
| OI Order | Exchange/Platform | Open Interest (USD) |
|---|---|---|
| 1 | Binance | $2.77B |
| 2 | Hyperliquid | $1.92B |
| 3 | Bitunix | $1.57B |
| 4 | XT.COM | $1.41B |
| 5 | Bitget | $740.22M |
| 6 | OKX | $504.07M |
| 7 | Gate | $247.73M |
| 8 | BitMart | $208.33M |
| 9 | KuCoin | $165.84M |
| 10 | Phemex | $107.75M |
| 11 | Bybit | $97.48M |
| 12 | MEXC | $86.10M |
| 13 | Lighter | $67.76M |
| 14 | OrangeX | $48.78M |
| 15 | Ostium | $29.49M |
| 16 | Ourbit | $24.39M |
| 17 | Aster | $23.75M |
| 18 | Ondo Perps | $16.18M |
| 19 | BingX | $10.56M |
| 20 | Coinbase | $9.92M |
| 21 | Extended | $7.98M |
| 22 | Kraken | $4.47M |
| 23 | HTX | $4.43M |
| 24 | edgeX | $3.62M |
| 25 | GRVT | $3.14M |
| 26 | BitMEX | $1.75M |
| 27 | Crypto.com | $747.37K |
| 28 | Paradex | $36.41K |
| 29 | MSX | -- |
The values in the table are not comprehensive ratings. Even if the OI between adjacent platforms is close, they may still perform differently in terms of 24-hour trading, specific stock contract coverage, visible depth, and price spreads. The "--" in MSX simply means that this snapshot does not show an available OI; it is not zero and should not be padded to an assumed value.
Which fields should be read together with the position size
After using the OI ranking as the first level of screening, the next step is not to convert the number into a "good or bad" total score, but to fill in the questions it does not answer item by item: whether there have been transactions in the past period, whether the target contract currently has a visible quote, and which contracts this total covers.
Ask first: whether the existing contract is accompanied by transaction activities at the same time
BIS treats OI as an outstanding position in exchange derivatives statistics and discusses turnover as another activity indicator. BIS's statistical explanation provides the background for this distinction: existing positions and trading activities in a certain period belong to different observation dimensions.
Trading volume counts contracts that have been traded, while OI counts contracts that remain open. ICE Notes on Futures Market Indicators also compares average daily volume to OI are listed as market activity indicators respectively. When studying, the trading volume of the same observation window should be read next to OI, rather than replacing one with the other.
Ask again: whether the quotation of the specific contract can undertake the research object
RootData's equity derivatives ranking notes list OI, volume, liquidity and spreads as independent comparison factors. Looking at RootData's stock derivatives ranking description, you can see that these fields serve different problems: OI is a stock clue; liquidity and spread are closer to the quotation and transaction cost observation at a certain point in time.
The key here is to observe the hierarchy. The order book is a collection of buy and sell orders visible in real-time for a specific contract. The order book depth and spread must be confirmed on a specific stock perpetual contract and at a specific time point. The total OI of the exchange is an aggregate field; even if the OI of the overall list is very high, it cannot replace viewing the real-time buying and selling orders of the target contract.
Final question: Which stock perpetual contracts are covered by the total OI
RootData public data standard description, so when comparing frozen snapshots and dynamic pages, you should first confirm the observation time and field caliber. RootData's Data Standard Description is the public method basis for this step. First confirm whether you are studying the exchange-level total volume or a certain stock contract, and then compare the fields at the same time point to avoid piecing different ranges of data into one conclusion.
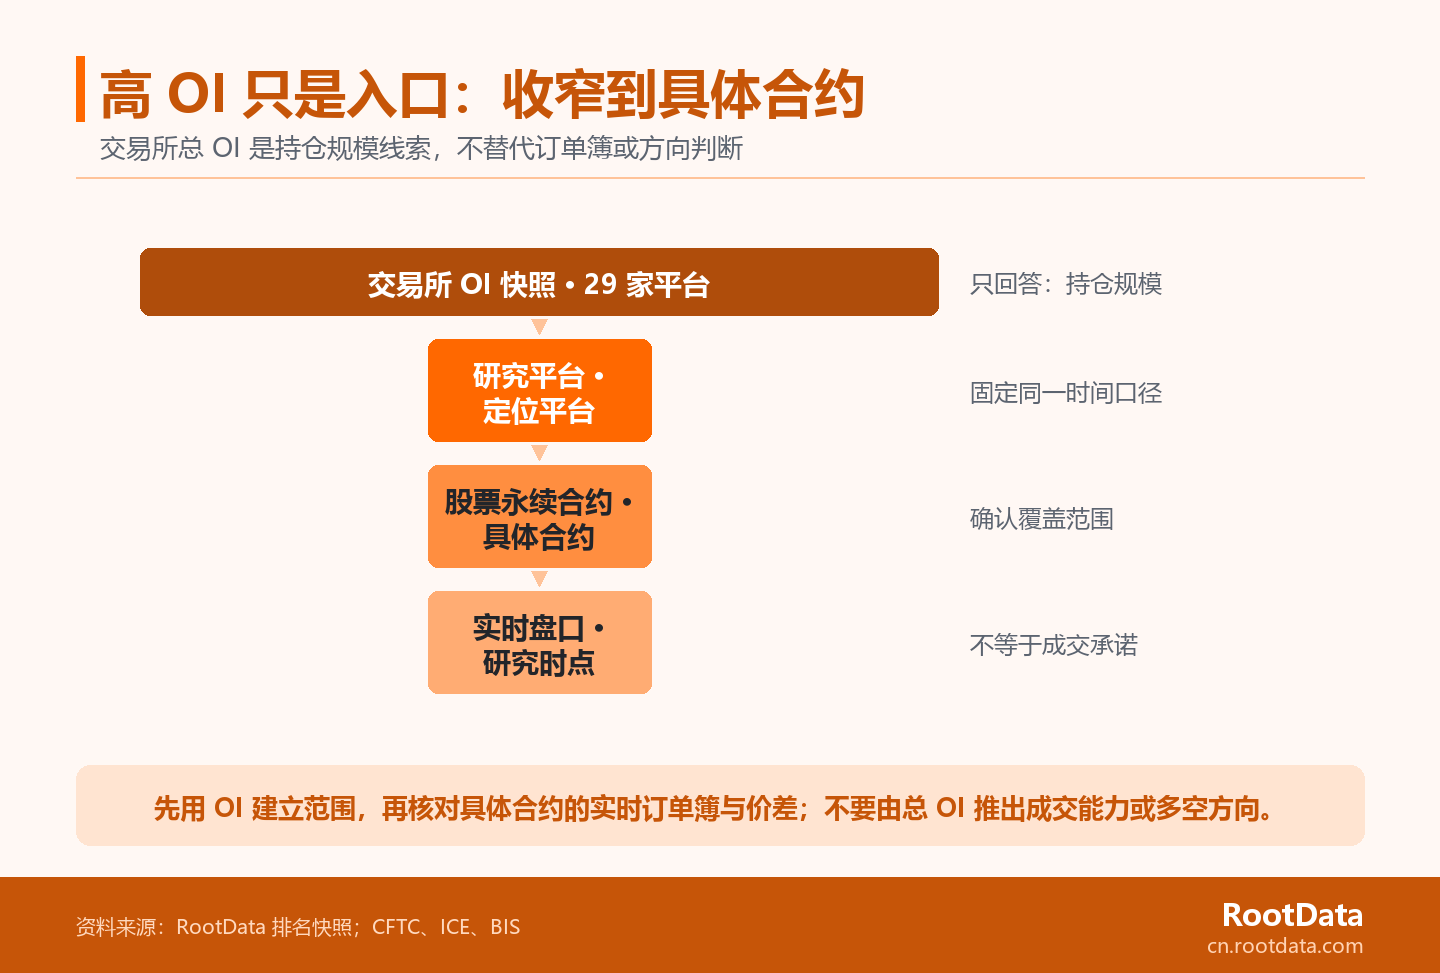
Research Example: Why $1B OI Still Isn’t a Replacement for Single-Contract Review
The exchange's total OI, even if it is in the billions of dollars, does not replace the order book, spread and visible orders of a certain stock perpetual contract at the time of research. Taking the $1.41B snapshot of XT.COM in the table as an example, this value only shows that the total OI of the stock perpetual contract displayed by the platform at that point in time is in the order of one billion U.S. dollars; it cannot directly answer whether the buying and selling orders for a given stock contract at this time are sufficient, whether the price difference is suitable for the research objectives, or how much impact a specific order will have.
A safer approach is to first use the overall list for screening, then select a specific stock perpetual contract, and save the OI, 24-hour transactions, bid-ask spread and visible depth at the same time. If the update time of any field is different, mark it as a different time layer instead of summarizing them into a seemingly accurate execution conclusion.
Study the three-step review of OI ranking: fixed snapshot, position contract, refresh field
Fixed snapshot, positioning contract and refreshing fields are a set of work sequences to convert the OI summary list into one that can be reviewed and compared. Its goal is not to create new rankings, but to ensure that every comparison can be returned to a clear point in time and object.
- Fixed starting point. Record the snapshot time of this article to avoid mixing historical OI with subsequently updated fields.
- Targeted objects. Enter a clear perpetual contract of a stock from the exchange level, and do not directly write the total amount of the platform into a single contract status.
- Refresh dynamic fields. Recheck the latest transactions, visible order books and price spreads of the target contract; if you need to continue research, you can View the RootData stock trading platform ranking and refer to the latest display on the page.
Four judgments that this OI snapshot does not replace
RootData's Disclaimer provides the usage boundaries of this article. RootData's disclaimer positions the content as an information service and not investment advice. The ordering in this article is suitable for understanding the fields and establishing the research sequence, but it does not replace the following judgment:
- Whether a certain platform or product is suitable for any individual or organization;
- The real-time trading ability, price impact or slippage of a certain stock perpetual contract;
- Admission, compliance or product availability conclusions for any region;
- Predictions of price direction, return or risk outcomes.
FAQ
FAQ only clarifies table read boundaries for OI, volume, direction and missing values. The following answers do not add new platform functions, regional qualifications or legal conclusions, but only help readers put the fields in the same snapshot back into questions that they can answer.
Does the higher the OI mean the exchange must have better liquidity?
No. OI describes the size of the contract that still exists, while liquidity depends on the order book depth, bid-ask spread and visible pending orders under the specific contract and specific time point. High OI can be used as a clue for continued research, but it cannot directly convert the total volume at the exchange level into a certain order, which will definitely make it easier to complete. Even if the OI of two platforms is close, the target stock perpetual contract's visible bid and ask order, quote update speed, and transaction costs may differ; these fields should be left in their own observation levels when comparing.
Can OI tell me if the market is bullish or bearish?
Cannot be judged alone. Total OI records the size of open contracts; at the aggregate level, long and short contracts correspond to each other. To study the structure or direction of market participants, additional data of the same caliber and matching the research object are needed, and conclusions cannot be drawn from just one OI number. Particularly in exchange-level aggregate values, where positions of different underlyings, expirations or perpetual contracts are aggregated, a single total does not provide sufficient account or position composition information to identify net direction.
Are OI and 24-hour trading volume interchangeable?
No. The 24-hour trading volume records the transactions that have occurred during the specified period, and the OI records the contracts that are still open at a certain point in time. The two can be put together to help understand market activities, but their respective observation times and questions are different, and they are not suitable for replacing each other or simply adding them. In practice, you can first use OI to identify the size of the existing contract, and then use the trading volume in the same time window to observe recent activities; if the time points are different, the time tags should be retained instead of combining the two numbers into one comprehensive judgment.
Why should MSX’s “--” be retained in the OI ranking list?
Because this RootData snapshot does not show available OI values. Keeping "--" is more accurate than converting undisplayed data to zero: it explicitly tells the reader that the field is not comparable in that snapshot, rather than creating a final value or sorting conclusion that does not actually exist. The missing display does not mean that the platform does not have any relevant contracts or activities; it only means that under the fixed page snapshot and field caliber of this article, there is no OI value that can be used for sorting in the same table, so it should not be filled in by guessing.