
Are More Contracts Always Better? A Cross-Ranking of Coverage Breadth and Actual Tradability
The number of contracts expands the candidate pool, but it cannot alone represent true tradability. Thinking of it as a "usefulness" ranking list of tokenized stock trading platforms will confuse two issues: how many targets can be researched on the page, and whether a certain target can be traded under observable conditions at the moment, which are not the same thing. True tradability also needs to go back to the transaction, liquidity and spread fields at the same point in time; by splitting these two layers, we can avoid misinterpreting "can be found" as "easier to transact".
 Author: Flowie|ChainCatcher content author, following RWA, interpreting the true narrative of Web3. Follow X
When reading the contract quantity, first separate "coverage" and "tradable"
- The number of contracts is suitable for answering "whether the target has entered the candidate pool", but not suitable for answering alone "can the transaction be completed under reasonable conditions now".
- 24-hour volume, ±2% weighted liquidity, and spreads are not synonymous; they respectively indicate activity over time, observable liquidity around quotes, and the distance between bids and offers.
- If the key field is displayed as -- or Pending, the coverage information can be retained, but the row should not be included in the true tradability comparison of the same caliber.
Screen coverage first, then verify and execute: one number cannot answer two questions
Coverage number and execution quality should be read at two levels: candidate pool and executability. The first step is to use the contract number to find the candidate range: it tells you how many stock derivatives targets may appear in a platform directory. The second step is to look at the execution fields: volume, ±2% weighted liquidity, spreads and field completeness at the same snapshot to determine whether these candidates are worth continuing to study side by side. This is not a formula for scoring a platform, but rather putting catalog information and execution information back in their place.
There is no single universally correct liquidity metric. BIS explanation of liquidity measures ranks spreads, market depth and price shocks as observed dimensions. For the purpose of this question, this means that both contract count and 24-hour volume can provide clues, but neither should replace the rest of the execution fields.
First level: The number of contracts is used to filter the underlying candidate pool
The number of contracts first answers whether the target object may appear within the researchable range of a platform. RootData's Equity Derivatives Ranking Description Includes the number of equity contracts as a public field and one of the scoring considerations, along with displaying other market fields. Readers can first use it to confirm whether the target is likely to appear among the candidates, and then continue to check the specific contract rules and current status of the target.
The second level: transaction, liquidity and spread each answer different execution questions
The spread and quotation depth respectively correspond to the immediate cost and the quantity that can be traded without accepting a worse price. The spread is the distance between the best bid and ask quotes, which is usually closer to the real-time quote cost; the ±2% weighted liquidity is the liquidity field displayed on the RootData page that surrounds a certain range of quotes. The Federal Reserve’s explanation of spreads and quotation depth points out that narrower spreads can correspond to lower transaction costs, while larger quotation depth helps to undertake larger quantities without having to immediately bear worse prices. The concepts here are used to explain the fields and do not constitute a transaction commitment by any platform.
With different order sizes, spreads, order book depth, and total trading volume over a period of time explain the execution quality differently. 24-hour trading volume answers how much activity has occurred within a time window, but it cannot directly replace the order book conditions at a certain moment. CFTC Study on Liquidity in Futures Markets distinguishes between the different uses of small active trading, deep demand for larger orders, and total daily volume. Therefore, when encountering research needs for larger or specific targets, trading volume should be regarded as a background signal rather than a substitute for the number of transactions that can be made in a single transaction.
The same snapshot for 29 platforms: coverage numbers from 10 to 313, but fields are read together
RootData's frozen snapshot at 17:30 on July 23, 2026 covers 29 platforms, with the number of contracts ranging from 10 to 313. This article uses this frozen snapshot rather than real-time market conditions; sorted by the number of these 29 contracts, the median is 96. RootData stock derivatives ranking page simultaneously displays the number of contracts, 24-hour trading volume, ±2% weighted liquidity, spread and missing status, so cross-reading at the same time point is possible.
The equity derivatives ranking disclosure notes list number of contracts, liquidity depth, spreads and data availability as different considerations. The table below is not a comprehensive ranking, nor does it imply that any platform is more suitable for certain types of transactions. It only selects a few significantly different field combinations from the same snapshot, indicating that high coverage, transaction activity, liquidity near quotes, and spreads can show different directions at the same time. The public field description for equity derivatives also treats coverage, liquidity, spreads and data availability as separate considerations rather than as one interchangeable number.
| Platform (example) | Number of contracts | 24-hour trading volume | ±2% weighted liquidity | Spread |
|---|---|---|---|---|
| Gate | 275 | $1.02B | $3.90M | 0.061% |
| Binance | 144 | $16.72B | $12.92M | 0.014% |
| Bitget | 252 | $2.03B | $4.19M | 0.061% |
| BingX | 291 | $376.16M | $3.25M | 0.409% |
| BitMart | 313 | $318.09M | $554.08K | 4.24% |
For example, BitMart shows 313 contracts in this snapshot, but the remaining three fields differ significantly from the other examples in the table; Binance does not have the highest number of contracts, but shows higher volume and ±2% weighted liquidity in the same row, as well as tighter spreads. This difference does not lead to the conclusion of "who is better", it only shows that the number of contracts cannot skip the execution field and directly becomes synonymous with the quality of the platform.
Stop line for cross comparison: high coverage is not a pass, and missing is not zero
High-coverage platforms should still perform field review through the same snapshot; when key fields are missing, they should not enter the same-caliber comprehensive ranking. The specific method is to first set two stop lines: the coverage number can only put the platform into the candidate pool, but cannot directly generate the real tradability order; as long as key fields such as liquidity or spread are missing, the comprehensive comparison between the bank and the complete field platform will be stopped. -- and Pending appearing in frozen snapshots are data states and should not be padded to zero, defaulted to favorable, or interpreted as some platform feature.
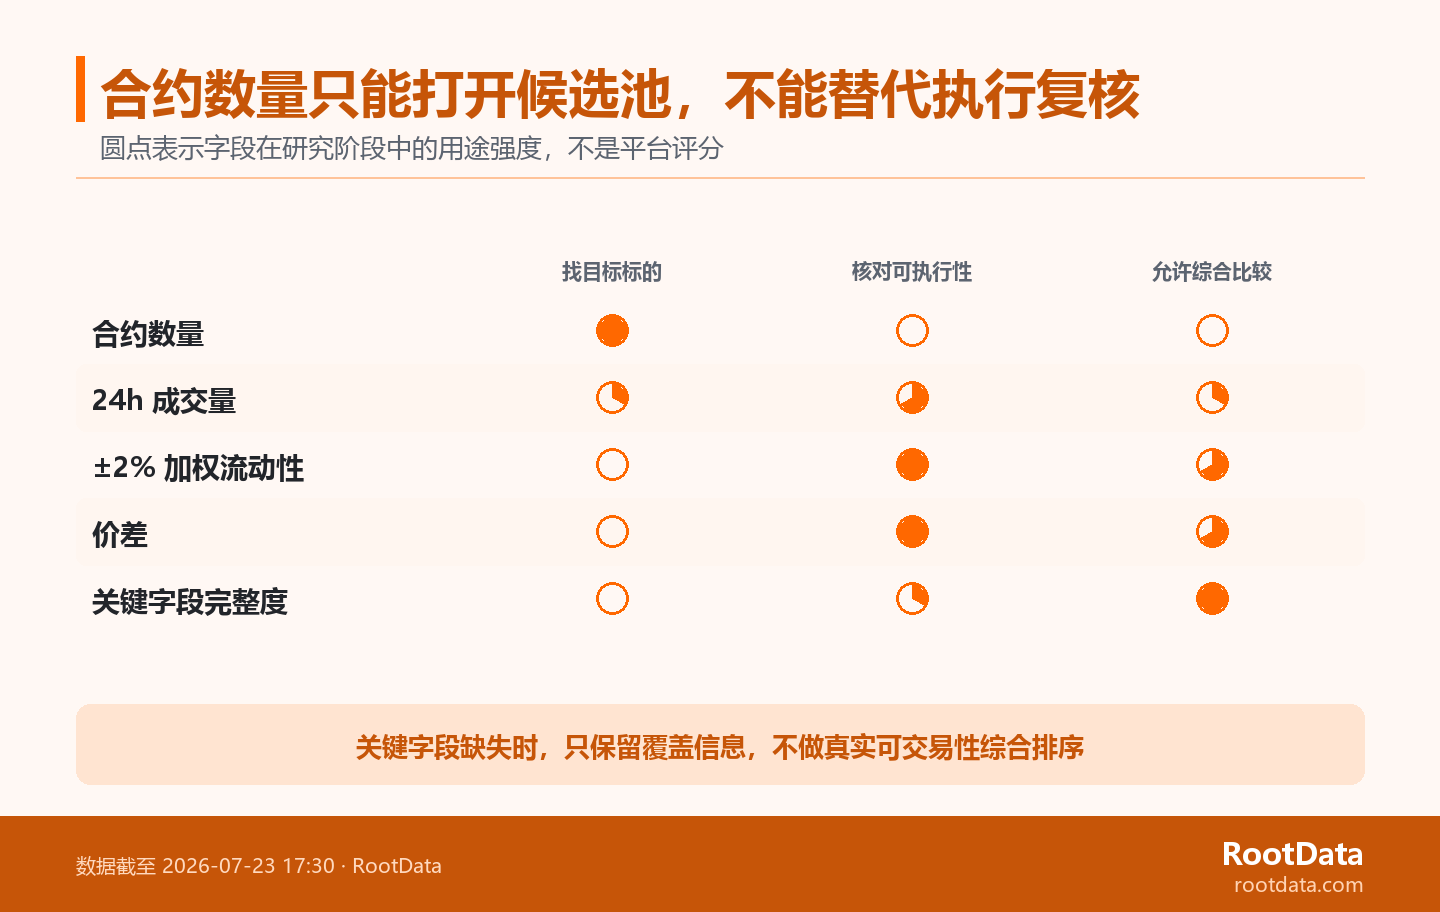
Tighter spreads and greater depth are both liquidity signals, but they still describe different execution conditions. When the fields are complete, the cross-comparison should also retain the division of labor: the spread explains more about the quote distance, and the depth explains more about the quantity that can be undertaken near the given price. The Fed's Market Liquidity Note links the two to transaction costs and the price impact of larger quantities, respectively. Narrow spreads, then, can be a signal to continue observing, but cannot alone cover the rules of depth, trading activity, or the target contract itself.
Find the target first, and then verify whether it is worthy of comparison: four-step review path
First filter the target, then compare the execution fields of the same snapshot, and finally check the target contract rules. This is the research sequence to avoid misreading of single fields. The reusable sequence is: record the observation time to avoid taking the old snapshot as the current state; use the contract number to confirm whether the target has entered the candidate pool; horizontally check the trading volume, ±2% weighted liquidity, price difference and field completeness; then return to the target contract page to verify the product rules, available status and applicable conditions. The first two steps deal with "where to look", and the last two steps deal with "whether it is worth continuing to study".
RootData's general exchange ranking method also uses multi-dimensional information, but this article still uses the exclusive guide to stock derivatives as the specific scope. Explanation of exchange ranking method Use multi-dimensional data instead of directly treating one item of activity or coverage as the entire judgment. This article does not extrapolate general exchange methods to a tradability guarantee for a specific contract.
When rechecking, update the snapshot first and then return to the target contract
When re-comparing dynamic fields, the new observation time and field status should be recorded first, and then return to the target contract to verify the specific conditions. The above two levels of reading can then be repeated, but the numbers in the old table will not be used to make immediate judgments. When you need to re-view the same set of fields, you can View RootData stock trading platform ranking, and record the number of contracts, trading volume, liquidity, spread and missing status at the same point in time.
RootData Open Data Standard describes the boundaries of its data collection, validation and structuring. RootData Data Standard also illustrates cleansing and standardization boundaries for public data; this is why "the last single number seen at a glance" should not be interpreted in isolation from time, field status, and target contract conditions.
This is not a “easiest platform to trade” ranking list
Snapshots and field intersections are the starting point for research and do not constitute investment advice or judgment on platform suitability. This cross-reading table is used to establish the research sequence and does not provide account adaptation conclusions or regional access judgments. Contract structure, fees, margins, local rules and individual account conditions all need to be verified separately. RootData's Disclaimer also positions the relevant information as information and research services; frozen snapshots can help discover fields that need to be questioned, but cannot replace the confirmation of specific transaction conditions.
FAQ
FAQ only clarifies field usage and data boundaries, and does not add new platform functions or qualification judgments. The following questions do not change the two-level reading of the text: first use the contract number for the candidate range, and then use the execution field and data status for review.
Will the platform with the largest number of contracts be suitable for all stock perpetual needs?
Not necessarily. The number of contracts will only expand the candidate pool that can be studied, but it cannot prove that each target has the same closing conditions at a certain point in time. After entering the candidate, you still need to check the transaction activity, liquidity near the quotation, price spread, product rules and fields for the target contract; these conditions will not be automatically derived from the coverage number. If a key field is missing, the comparison should be stopped at the candidate pool level first, rather than supplementing the conclusion with coverage numbers.
Does high 24-hour trading volume mean that large orders are easier to close?
Not necessarily. The 24-hour trading volume records the activities that have occurred within a time period and cannot directly show what kind of quotation and price impact a large order will encounter at the moment. When studying larger orders, additional observations should be made about the order book depth, spreads, and visible liquidity of the target contract at the time, and interpreted separately from historical volumes. If the information cannot be obtained at the same observation time, historical totals cannot be used to replace immediate conditions.
Why is it still necessary to look at ±2% weighted liquidity when the spread is so narrow?
Because the narrow spread mainly describes the distance between the best bid and offer quotes, it cannot alone explain how much quantity can be accepted within a wider quote range. ±2% weighted liquidity provides another layer of perspective: it helps readers determine whether the liquidity field near the quote corroborates the spread signal, rather than treating a beautiful number as a complete execution conclusion. When one of the items is missing or the time is inconsistent, the other item cannot be expanded into a complete conclusion.
When liquidity or spread is displayed as "--" or "Pending", how should it be compared?
It should not be padded with zeros, nor should it default to a benefit or disadvantage to the platform. At this time, the contract quantity can be retained as directory coverage information, but the row should be excluded from comprehensive comparisons that require the same caliber of liquidity and spread fields. Once the field becomes available again, reread it with the new observation time instead of filling in the gaps with guesswork. The new snapshot time should be marked before re-reading to avoid putting different states before and after in one table.