
Tokenized Stock Exchange 24h Volume Ranking: Does High Activity Mean Better Execution?
Author: Flowie|Content author at ChainCatcher, focused on RWA and decoding real narratives in Web3.
RootData's stock derivatives ranking guide lists trading activity separately from other comparison fields: high trading volume shows activity within the observation window, but does not by itself prove that any given order can be filled right now with low friction.
This article organizes RootData's snapshot of 29 tokenized stock exchanges and related derivatives platforms by the activity field shown on the page, from high to low. The data is current as of 17:30 on July 23, 2026, sourced from RootData; it is meant to help build a research candidate pool, not to translate a single rank directly into a conclusion that "everyone gets better execution."
The takeaway first: high trading volume shows activity, not necessarily better execution
- Look at what it answers first. 24-hour trading volume records the value of trades already completed within a specified window, offering a window into recent activity.
- Then look at what it does not answer. It cannot by itself show how much size the order book can currently absorb, nor the immediate quote friction between buying and selling.
- Finally, fix the comparison conditions. Cross-check activity, order book depth, and the bid-ask spread at the same point in time — otherwise different questions get collapsed into one claim of "best execution."
What volume, depth, and spread each answer
BIS research on market liquidity and RootData's stock derivatives ranking guide both observe trading activity separately from other market fields. 24-hour trading volume records the value of trades that have already occurred within a specified window, so it is better suited to answering questions about recent activity than to predicting on its own whether any given order can be filled right now with low friction.
That BIS research discusses different dimensions of liquidity separately. Order book depth and the bid-ask spread are used respectively to observe available resting orders and how tight quotes are right now — neither is the same question as historical trading volume. Here, ±2% weighted liquidity refers to the order book depth field used for side-by-side comparison within a 2% band above and below the current price; spread is the distance between the bid and ask quotes, used to observe how tight quotes are in real time.
As a result, rows with high trading volume deserve priority entry into a candidate pool; but when a research target has specific requirements around order size, execution speed, or cost, one should still return to the liquidity and spread fields on that same row. Where a given field displays as -- or Pending on this snapshot, this article preserves it as-is — it is not converted to zero, and platform capability is not inferred from a missing state.
A 24-hour trading volume snapshot of 29 tokenized stock exchanges and related platforms
The RootData stock derivatives ranking page is the sole source of figures for the table below. The table below fully preserves the 24-hour trading volume and the page's original missing-data states for the 29 platforms as displayed by RootData at 17:30 on July 23, 2026. The "Composite Rank" column in the table is the composite ranking shown on that page, not a score recalculated by trading volume.
To make the table easier to read, the first column is sorted from highest to lowest by 24-hour trading volume; "Composite Rank" preserves the original rank as displayed on the RootData page at the time. Dollar figures, percentages, --, and Pending all retain the page's original display format. Auxiliary percentages shown alongside OI and volume on the page, which are not separately defined, are not used for the sorting or interpretation in this article.
| Volume Rank | Composite Rank | Platform | 24h Volume | ±2% Weighted Liquidity | Spread |
|---|---|---|---|---|---|
| 1 | 1 | Binance | $16.72B | $12.92M | 0.014% |
| 2 | 7 | Hyperliquid | $4.57B | $2.1M | 0.176% |
| 3 | 3 | OKX | $3.88B | $3.9M | 0.013% |
| 4 | 19 | MSX | $3.12B | $183.65K | 0.673% |
| 5 | 4 | Bitget | $2.03B | $4.19M | 0.061% |
| 6 | 5 | Ourbit | $1.8B | $4.5M | 0.053% |
| 7 | 10 | XT.COM | $1.04B | $193.05K | 0.262% |
| 8 | 6 | Gate | $1.02B | $3.9M | 0.061% |
| 9 | 2 | Bybit | $896.59M | $1.01M | 0.051% |
| 10 | 14 | Bitunix | $423.8M | $3.17M | 0.073% |
| 11 | 9 | BingX | $376.16M | $3.25M | 0.409% |
| 12 | 23 | BitMart | $318.09M | $554.08K | 4.24% |
| 13 | 18 | MEXC | $268.94M | $10.74M | 0.3% |
| 14 | 20 | OrangeX | $138.36M | $27.58K | 0.517% |
| 15 | 16 | KuCoin | $77.7M | $63.49K | 0.36% |
| 16 | 21 | Coinbase | $63M | -- | 0.38% |
| 17 | 11 | Ondo Perps | $58.3M | $1.97M | 0.137% |
| 18 | 12 | Extended | $45.27M | $265K | 0.146% |
| 19 | 8 | Lighter | $44.47M | $4.24M | 0.277% |
| 20 | 17 | edgeX | $34.09M | $219.15K | 0.347% |
| 21 | 13 | Phemex | $30.82M | $85.12K | 0.308% |
| 22 | 22 | Aster | $28.42M | $1.06M | 0.563% |
| 23 | 15 | GRVT | $26.14M | $517.49K | 0.083% |
| 24 | 24 | HTX | $25.87M | $963.37K | 0.908% |
| 25 | 27 | Crypto.com | $4.63M | $424.48K | 1.35% |
| 26 | 26 | Kraken | $4.44M | $455.29K | 0.45% |
| 27 | 25 | BitMEX | $2.26M | $226.33K | 0.365% |
| 28 | 28 | Paradex | $8.41K | $1.59K | 0.928% |
| 29 | 29 | Ostium | $0 | -- | Pending |
The value of this table lies in its full coverage, not just the magnitude differences among the top rows. For instance, the composite rank and the volume rank do not always align: the composite score shown on the page also factors in liquidity, spread, contract coverage, and other fields. For readers building a candidate pool, the volume rank can serve as a first-pass sort; for readers who need to assess actual execution conditions, the field-by-field check that follows determines whether this ranking applies to them.
Three cross-checks to make when reading the volume ranking
RootData's general exchange ranking methodology also emphasizes multi-dimensional data rather than volume alone. Using volume to sort a candidate pool, then verifying execution conditions with ±2% weighted liquidity and spread from the same point in time, is a more verifiable research sequence than looking at volume alone.
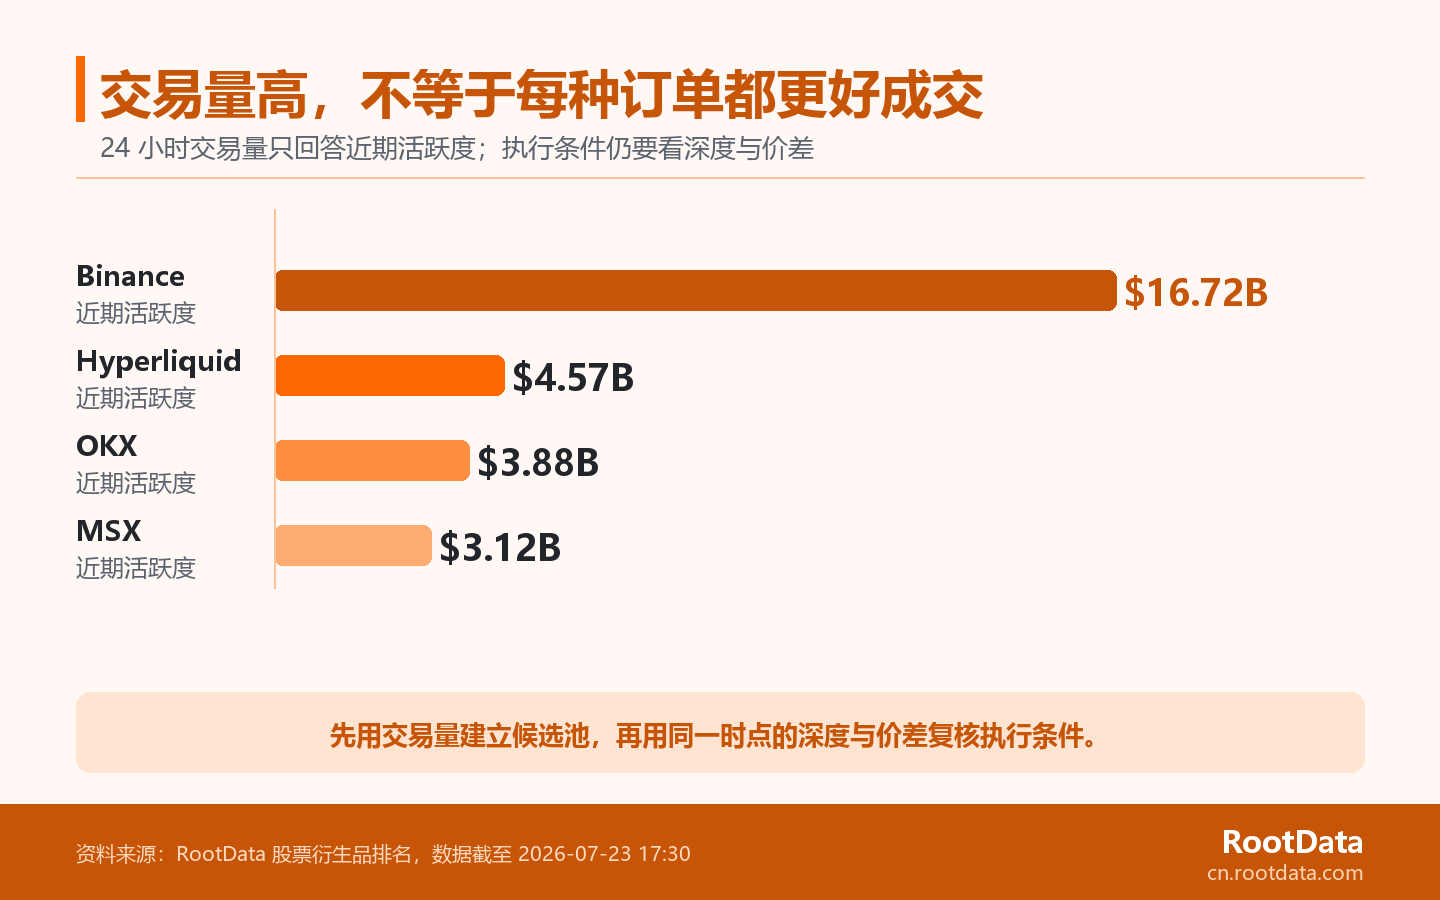
Step one: treat volume as an activity ranking, not an execution conclusion
Start by using 24-hour trading volume to understand where recent trading has mainly concentrated. The purpose of this step is to narrow the research scope, not to label any single platform as having "the best liquidity." This is especially true when the dataset spans billions, hundreds of millions, tens of millions, and smaller figures at the same time — the magnitude differences are worth further observation, but volume can still only answer what activity has already occurred; it cannot judge the price impact of a reader's next order.
Step two: check ±2% weighted liquidity on the same row
If the research goal involves a larger order size or observing how much the order book can absorb, volume should be viewed side by side with ±2% weighted liquidity from the same point in time. The former shows how much has traded over the past 24 hours; the latter provides a comparative clue about order book depth near the current price. Different magnitudes between the two do not automatically point to good or bad — they instead remind the reader not to substitute one historical result for another real-time condition.
Step three: treat spread as another layer of real-time friction
Spread provides another layer of real-time quote signal. Even when two platforms have similar trading volume, their spreads may differ; likewise, higher trading volume does not necessarily mean tighter quotes for every instrument at every moment. For a specific research target, a more reliable approach is to record the target contract, the observation time, and the order size, then return to the page to verify with the same fields — rather than extrapolating from aggregate volume to every instrument.
Using the ranking for research: sort first, then verify conditions
RootData's data standards documentation reminds readers that comparison requires a consistent basis; and BIS research on trading costs, depth, and spread also discusses volume, spread, and depth separately. When using a volume ranking, first fix the timestamp, then verify candidate platforms on an updated page using the same fields.
- Write down the research purpose. Are you observing recent market activity, looking for platforms covering a certain type of contract, or researching execution conditions? Different purposes give trading volume different weight in the judgment.
- Build the candidate pool using the full table. Start by reviewing all 29 platforms in this volume ranking, keeping fields that are not displayed rather than skipping comparable data just because a platform ranks lower.
- Go back to the updated page to verify. Data snapshots change over time; after completing a static first pass, you can view RootData's stock trading platform ranking to re-verify candidate platforms using updated volume, liquidity, and spread fields.
Four checks this snapshot cannot replace
RootData's public disclaimer clarifies the boundaries of its service. RootData's public disclaimer positions its content as an information service rather than investment advice, so the ranking table in this article is suited for comparison and research, not as a substitute for personalized judgment.
- Cannot replace real-time data. This article corresponds only to the page snapshot from 17:30 on July 23, 2026; if core fields change before publication, the table, charts, and timestamp should be refreshed accordingly.
- Cannot replace product verification. Perpetuals, tokenized spot, or other derivative structures related to "stocks" are not inherently the same. Readers should check specific product documentation, settlement arrangements, and risk disclosures rather than inferring rights from a platform's name.
- Cannot replace regional access judgment. Region, user identity, product version, and platform rules all affect actual availability; this article does not draw a binary compliance conclusion for any region.
- Cannot replace risk judgment. Factors such as leverage, price volatility, and platform and network security are not automatically eliminated by trading volume or composite rank. The data table can help with comparison, but it cannot replace independent verification and risk management.
FAQ
The FAQ below only explains the boundaries of reading this table; it does not add new platform features, regional eligibility, or legal conclusions.
Does the platform with the highest 24-hour trading volume necessarily offer the easiest execution?
Not necessarily; trading volume reflects activity that has already occurred, while real-time execution also depends on order book depth and spread at the same point in time. For a specific contract, order size, observation timing, and the direction of the trade will all change the actual experience. A more reliable approach is to first use trading volume as a sorting clue for the candidate pool, then compare whether that platform's corresponding fields are sufficient to support your research goal — rather than treating aggregate trading volume as an execution guarantee for any order.
Why does the table preserve missing or undisplayed states on the page instead of converting them to zero?
Because "not displayed" only means the page did not provide a usable value this time — it cannot be treated as equivalent to a value of zero. Rewriting --, Pending, or other undisplayed states as zero would make readers think a comparable calculation had been completed for that field, leading to incorrect side-by-side conclusions. This article therefore preserves the page's original states; when a key field is missing, a more appropriate approach is to narrow the scope of judgment, or return to the updated page and primary product materials to continue verification.
Can trading volume and open interest be used interchangeably?
No. Trading volume describes trading activity that has already occurred within an observation window; open interest describes the size of contracts that have not yet been closed. The two may rise together, fall together, or move in different directions — but when auxiliary percentages shown alongside them on the page are not separately defined, they should not be interpreted on your own as a price change, market share, or other metric. When making comparisons, treat the two fields as clues to different questions, and read them within the same fixed snapshot.
Can this table determine whether I can use a given platform in my region?
No. Regional access depends on the specific product, user identity, platform rules, and local requirements, and it can change over time and with product structure. Trading volume, depth, and spread can only help compare market data — they cannot prove that a given reader is actually eligible to use a platform, and they certainly cannot substitute for legal advice. Before preparing to use any product, readers should rely on the platform's product documentation, access rules, and authoritative information for the applicable region at that time, and confirm they understand the relevant risks and conditions.