
2026 Tokenized Stock Exchange Rankings and Selection Guide: RootData's Read on 29 Platforms
Author: Flowie|Content writer at ChainCatcher, focused on RWA, decoding the real narratives behind Web3.
The value of a tokenized stock exchange ranking isn't to declare a single "best" platform on behalf of any reader — it's to make the comparison process auditable: first see what the composite score covers, then filter using execution quality, product coverage, and rights structure. For someone who needs to execute trades, a top rank doesn't automatically answer whether the spread and order book depth are suitable; for someone researching a specific underlying, contract count doesn't automatically answer product rights or regional access. All ranking figures below come from a single RootData snapshot taken at one point in time — they are not written here as a live recommendation.
First, get this straight: this ranking doesn't measure a single "best"
RootData's explanation of scoring factors and its data standard together form the basis for how this article reads the numbers. RootData's composite score for stock derivatives considers trading volume, open interest, order book depth, spread, fees, funding rate, contract count, margin pathways, and data availability at the same time; a unified comparison assumes its published data standard as a precondition.
This RootData snapshot preserves the page's displayed timestamp. This article uses the snapshot of 29 platforms that RootData displayed at 17:30 on July 23, 2026; all figures in the tables below are as of that point in time.
To avoid treating a field as just a label, "±2% weighted liquidity" refers to a comparable order book depth metric within a 2% band above and below the current price; together with spread, it helps readers observe order book conditions within a similar price range.
- The composite score is a good starting point, not an endpoint. It aggregates multiple comparable factors into a ranking, but the full weighting and formula are not disclosed, so it shouldn't be used to reverse-engineer "which single metric determined the rank."
- This article covers stock perpetuals or related derivatives platforms. RootData's dedicated notes explicitly exclude real stock spot trading, indices, commodities, and forex derivatives; this is not a list of platforms holding actual equities in custody.
- The same field should be compared within the same snapshot. Liquidity, spread, open interest, and volume all change over time; combining figures observed at different times will make conclusions incomparable.
- A missing display is also information. "--" and "Pending" mean the page did not display a value or the value is pending at the time of this snapshot; they should not be arbitrarily treated as zero, nor should readers infer that the platform lacks that capability.
So the correct way to read this is not "whoever ranks first is right for me" — it's to first confirm whether you personally care more about execution friction, researchable contract coverage, or product structure and terms of use. The composite score puts these three types of questions on the same starting table, but it will not complete the final layer of verification on the reader's behalf.
Snapshot of 29 platforms: see the full table first, then filter
The rankings page snapshot is the sole numerical source for the table below. The table fully preserves all 29 platforms from this snapshot, along with the original missing-value displays such as "--" and "Pending."
The table prioritizes composite score, contract count, open interest, 24-hour volume, ±2% weighted liquidity, and spread. Fees, funding rates, and margin currencies are also fields visible on the RootData page, but cramming every field into one table would sacrifice readability across rows; they're better suited for readers to revisit on the live page item by item once a shortlist has been formed. The OI and volume auxiliary percentages that aren't separately defined on the page are not covered in this article's interpretation.
| Rank | Platform | Composite Score | Contracts | Open Interest | 24h Volume | ±2% Weighted Liquidity | Spread |
|---|---|---|---|---|---|---|---|
| 1 | Binance | 92.1 | 144 | $2.77B | $16.72B | $12.92M | 0.014% |
| 2 | Bybit | 91.2 | 131 | $97.48M | $896.59M | $1.01M | 0.051% |
| 3 | OKX | 91.2 | 131 | $504.07M | $3.88B | $3.9M | 0.013% |
| 4 | Bitget | 90.9 | 252 | $740.22M | $2.03B | $4.19M | 0.061% |
| 5 | Ourbit | 90.8 | 175 | $24.39M | $1.8B | $4.5M | 0.053% |
| 6 | Gate | 90 | 275 | $247.73M | $1.02B | $3.9M | 0.061% |
| 7 | Hyperliquid | 88.2 | 103 | $1.92B | $4.57B | $2.1M | 0.176% |
| 8 | Lighter | 85.7 | 47 | $67.76M | $44.47M | $4.24M | 0.277% |
| 9 | BingX | 84.2 | 291 | $10.56M | $376.16M | $3.25M | 0.409% |
| 10 | XT.COM | 83.6 | 107 | $1.41B | $1.04B | $193.05K | 0.262% |
| 11 | Ondo Perps | 81.5 | 21 | $16.18M | $58.3M | $1.97M | 0.137% |
| 12 | Extended | 81.4 | 19 | $7.98M | $45.27M | $265K | 0.146% |
| 13 | Phemex | 79.5 | 94 | $107.75M | $30.82M | $85.12K | 0.308% |
| 14 | Bitunix | 79.3 | 98 | $1.57B | $423.8M | $3.17M | 0.073% |
| 15 | GRVT | 79.2 | 29 | $3.14M | $26.14M | $517.49K | 0.083% |
| 16 | KuCoin | 79.1 | 125 | $165.84M | $77.7M | $63.49K | 0.36% |
| 17 | edgeX | 78 | 43 | $3.62M | $34.09M | $219.15K | 0.347% |
| 18 | MEXC | 78 | 47 | $86.1M | $268.94M | $10.74M | 0.3% |
| 19 | MSX | 77.1 | 116 | -- | $3.12B | $183.65K | 0.673% |
| 20 | OrangeX | 76.4 | 89 | $48.78M | $138.36M | $27.58K | 0.517% |
| 21 | Coinbase | 74.6 | 30 | $9.92M | $63M | -- | 0.38% |
| 22 | Aster | 73.8 | 96 | $23.75M | $28.42M | $1.06M | 0.563% |
| 23 | BitMart | 73.1 | 313 | $208.33M | $318.09M | $554.08K | 4.24% |
| 24 | HTX | 70.6 | 104 | $4.43M | $25.87M | $963.37K | 0.908% |
| 25 | BitMEX | 70.3 | 12 | $1.75M | $2.26M | $226.33K | 0.365% |
| 26 | Kraken | 64.9 | 11 | $4.47M | $4.44M | $455.29K | 0.45% |
| 27 | Crypto.com | 61 | 52 | $747.37K | $4.63M | $424.48K | 1.35% |
| 28 | Paradex | 57.5 | 10 | $36.41K | $8.41K | $1.59K | 0.928% |
| 29 | Ostium | 57.3 | 35 | $29.49M | $0 | -- | Pending |
The table itself doesn't offer a "suitable/not suitable" conclusion for any individual platform. For example, platforms with similar scores may show different combinations of contract count, order book depth, and spread; a platform ranked lower shouldn't disappear from your research scope just because its composite score is lower. A more useful approach is to first eliminate candidates from the 29 that fail your hard requirements, then return to the remaining platforms to compare the details.
Breaking the composite score into three decision paths
Subtracting first based on execution quality, then matching based on coverage and product structure, is a more reliable filtering sequence than simply copying the composite score. The point of this sequence isn't to artificially assign universal weights to metrics — it's to put the conditions that directly change your usage experience or rights boundary first: when a hard requirement isn't met, no matter how high the composite score is, it shouldn't automatically override that.
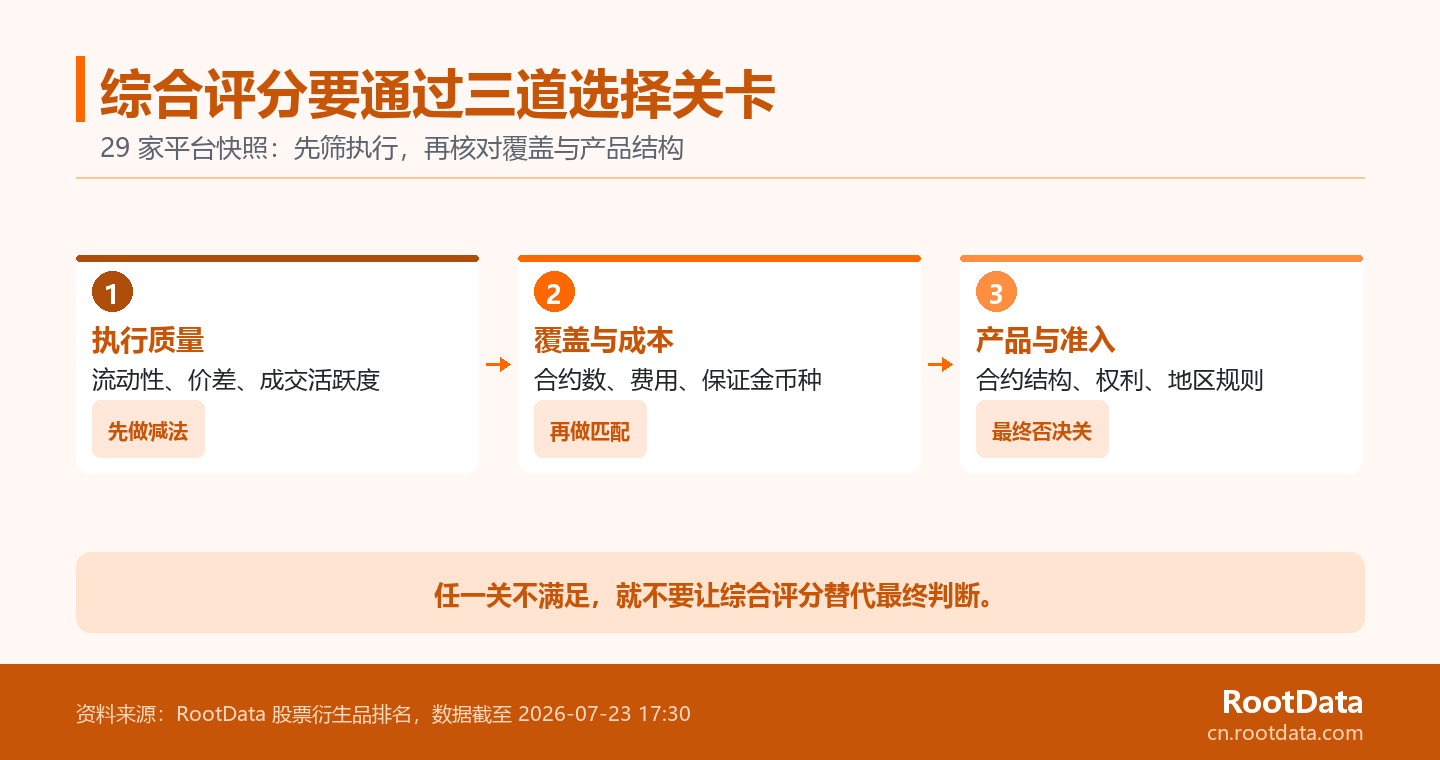
After completing this initial screen across the three priorities, you can view RootData's stock exchange rankings to re-verify candidate platforms using the same fields, updated.
- Set your execution threshold first: Are you planning to trade frequently and sensitive to price deviation, or doing only low-frequency research? The former should prioritize eliminating platforms with clearly mismatched order book depth or spread.
- Then set your coverage threshold: The number of underlyings you need to research, fee structure, and acceptable margin currencies determine which platforms are worth entering a second round of comparison.
- Finally set your structural threshold: Exactly what price exposure the contract provides, what rights the holder has, and whether your location permits use — if any of these is unclear, the composite score should not substitute for it.
First, look at execution friction: liquidity, spread, and trading activity
Open interest and 24-hour volume need to be read together with the same snapshot's ±2% weighted liquidity and spread to avoid treating activity alone as tradability. The definition of the liquidity field was given earlier; when filtering, it helps readers judge, together with spread, whether the order book appears thicker and whether bid/ask quotes are closer within the price range they care about.
Open interest is better suited to observing the scale of contracts not yet closed, while 24-hour volume reflects trading activity over a period of time; neither is a guarantee that any single order will necessarily be filled at the expected price. Taking this snapshot as an example, platforms such as Binance, MEXC, Bitget, Hyperliquid, and Lighter each have comparable strengths on different fields; readers should avoid letting one high number overshadow the other fields. For actual execution, it's best to write down your own order size, acceptable slippage, and holding period as explicit conditions, then check whether the order book and fee structure meet those conditions.
Then look at coverage and cost: contract count, fees, margin currencies
Contract count, fees, and margin currencies are comparison fields, but they cannot alone confirm the products or eligibility actually available to a given reader. A higher contract count suggests a potentially wider research scope, but it doesn't indicate that every underlying uses the same index, settlement method, or tradable conditions. Fees and funding rates should also be read in light of your holding period: short-term execution is more affected by entry/exit friction, while longer holding periods require checking ongoing costs together with contract mechanics.
So, contract count can be used to narrow your research pool, but it's not a substitute for product due diligence. For instance, Gate, BingX, and BitMart show higher contract counts in this snapshot; at the same time, mid-to-lower-tier platforms such as Ondo Perps, Extended, BitMEX, Kraken, and Paradex may also become candidates for specific research scopes. Readers should first list the underlyings they must cover and the margin currencies they can accept, then bring fees, funding rates, and liquidity into the same round of comparison.
Tokenized stocks, stock perpetuals, and actual stocks are not the same thing
Therefore, a "stock" name on a platform's listing, or similar price performance, cannot substitute for an item-by-item check of the contract, rights, and settlement arrangements. For every platform that makes your final shortlist, you should at minimum review the product documentation's reference underlying, price source, settlement and clearing arrangements, whether a redemption or custody mechanism exists, and any conditions related to region or user identity.
This is also why this article positions the composite ranking as a comparison tool, rather than calling it a list of "best tokenized stock platforms." RootData's stock ranking covers stock perpetuals or related derivatives platforms for which key market data can be obtained and verified — this is explicitly not equivalent to a comparison of actual stock spot trading. When readers see the same stock name, they should first ask "which type of contract or rights am I getting," before asking "where does it rank on the list."
Four boundaries to keep in mind when using this ranking
- It's a snapshot, not a real-time dashboard. This article fixes on the values displayed at 17:30 on July 23, 2026. Before publishing, researching, or actually using a platform, you should return to the rankings page to check the latest update time, rather than calling the numbers in this article "current."
- It explains factors, but doesn't disclose the full weighting. Readers can understand which fields are included in the composite comparison, but cannot reverse-engineer RootData's exact calculation formula from the ranking, nor should a platform's advantage on one field be exaggerated into the sole reason for its composite score.
- It cannot answer regional eligibility. Region-related rules change with product structure, user identity, and platform terms. A more neutral approach is to leave regional questions to the actual product documents, the platform's access notices, and authoritative local information, rather than having a ranking article deliver a binary "legal/illegal" verdict.
- It does not substitute for risk judgment. The CFTC's risk advisory notes that leverage amplifies risk and losses; platform and cybersecurity risks also need to be assessed separately. These kinds of risk are not the opposite of the composite score, nor can they be automatically eliminated by a higher rank.
When using the ranking for research, the most practical approach is to keep your own filtering criteria and the data's timestamp in mind: first write down your order size or research scope clearly, then mark the contracts and margin currencies you must cover, and finally check the product structure and regional conditions item by item. That way, the ranking's role is to reduce ineffective comparisons, not to replace your own judgment.
Frequently asked questions
The four questions below only address boundary misreadings that may still arise after reading the full article — they don't add new platform features or conclusions about regional eligibility.
Is the platform ranked first in composite score necessarily the best fit for me?
Not necessarily. The composite score places multiple market and product factors into the same comparison framework, and is well suited to building your first round of candidates; the final fit still depends on your execution needs, underlyings of interest, acceptable fees and margin currencies, and the actual rights structure the contract provides. If a platform fails one of your hard requirements — for example, your target underlying isn't covered, or the product terms are unclear — a higher composite score should not paper over that problem.
Do all 29 platforms offer the same kind of tokenized stock product?
No. This ranking covers stock perpetuals or related derivatives platforms for which RootData can obtain and verify key market data — it is not a list of actual stock spot holdings. Even if two platforms display an underlying with the same name, they may use different reference prices, settlement mechanisms, margin assets, or holder rights arrangements. When comparing, you should first read the specific contract and product documentation, then use the market fields in the ranking to observe execution conditions.
Do high open interest and 24-hour volume directly prove that a trade will be easier to fill?
Not directly. Open interest and volume help observe market participation and activity, but any single execution is still affected by order book depth, bid/ask spread, order size, and market volatility at that moment. A more reliable reading is to look at these two metrics together with ±2% weighted liquidity and spread at the same point in time; if one of them is missing, treat that as a signal to keep checking rather than filling it in as zero yourself.
Can this ranking tell me whether I can use a given platform from my region?
No. Regional access isn't a question that a platform name or a ranking alone can decide — it's jointly affected by the specific product, user identity, platform terms, and local requirements. This article deliberately avoids reducing it to a binary conclusion. Before actual use, you should rely on that platform's access notice and restriction terms for the relevant product, as well as authoritative information for your own region; if a key condition isn't clearly stated, you shouldn't treat a ranking as confirmation of eligibility.