
What are liquidity, trading depth, spreads and slippage?
On stock contract exchanges or other order-driven markets, multiple market indicators are often mentioned together, but they are not synonymous. What is even more confusing is that the best quote seen on the page is just the starting point for a certain amount at a certain moment; the average price at which an order can be completed depends on the size of the order, visible pending orders in the near price zone, and whether the market changes when the order is submitted.
When reading market fields on RootData’s Equity Derivatives data page, the most practical order is: Look firstquoteWhere to start, look againThe scale that can be undertaken in the near-price area, and use it lastactual transactionReview the results. This framework is for reading data and comparing conditions and does not predict prices nor does it constitute any trading advice.
When reading data, judge according to the three levels of "quote-scale-result"
- Read the quote first:The best bid and ask price tells you where the order started, not the average price of the entire order.
- Then bring in the scale:When the target amount exceeds the visible pending order in the near price zone, the order may continue to touch subsequent levels.
- Final check results:Comparing actual transactions with initial expectations can identify where deviations occurred.
The four indicators do not answer the same question
The four indicators do not answer the same question. They respectively correspond to the starting quotation, the scale that can be undertaken, the market status and the actual results after completion. The key for readers is not to rate a number in isolation as good or bad, but to first determine whether you are interpreting a starting quote, achievable capacity, or the final result.
| index | what does it describe | Alone can't explain anything |
|---|---|---|
| Liquidity | The combined impact on prices of purchases and sales of a specific size | A certain order must be completed at a certain price |
| Trading depth | Available scale visible within the specified price range | Will subsequent pending orders be filled in time? |
| bid-ask spread | The distance between the best bid price and the best sell price | Average closing cost for larger orders |
| Slippage | The deviation between expected price and actual transaction result | Fixed rates or platform attributes |
Therefore, when seeing the general term "liquidity", it is best to ask about its corresponding observation conditions: which contract, which time point, which price range, and what the target amount is. When conditions are inconsistent, two seemingly similar numbers may not be directly comparable.
Distinguish liquidity, depth and spread starting from the order book
The order book is a common observation window that distinguishes liquidity, depth and spreads. It breaks down the offer that the buyer is willing to pay and the offer that the seller is willing to accept: the closer the stall is to the current price, the earlier it is usually touched; the greater the number or amount of pending orders, the more visible the ability to undertake within a certain price range. The order book is just a snapshot that changes, but it helps the reader place several terms onto the same object.
Liquidity: How little impact buying or selling of a certain size has on the price
Liquidity looks at whether transactions of a certain size can be completed with less price impact.CFTC’s Futures GlossaryDescribe a liquid market as one in which one can buy or sell without significantly affecting the price. The key here is "some size": the same market may look smooth for smaller orders but may not perform the same for larger orders.
Therefore, liquidity does not only look at whether transactions have been active in the past, nor does it only look at the best quote. It is closer to a comprehensive state: the distance between quotes, the visible depth of the near price zone, the speed of order book changes and the target order size will all affect judgment. It is okay to use "good liquidity" as an abbreviation, but the comparison conditions cannot be omitted.
The depth of transaction depends on the scale, and the spread depends on the distance from the best quote.
The bid-ask spread looks at how far apart the highest buying price is from the lowest selling price.Investor Education Materials from Investor.govBid, ask and spread are also explained in terms of the highest bid price, lowest ask price and the difference between the two. It reflects the real-time price distance at the front end of the order book, not the entire cost that will be paid for the entire order.
Transaction depth depends on how much scale can be undertaken within a specified price range. The CFTC's study of futures market liquidity noted that the cost of small active orders can be approximated by the bid-ask spread, while larger orders require observing order book depth within a certain price range.View the study. Therefore, the depth field must be read together with the price range, direction and target amount; without these conditions, the information is still incomplete.
Slippage occurs when "seeing a quote" turns into "completing a transaction"
Slippage is the result that occurs between seeing a quote and completing a deal. Investor.gov reminds that quotes are for specific quantities, and when the market changes rapidly, the actual transaction price may differ from the quoted price seen.View transaction execution instructions. It is not a fixed percentage of disengaged orders: order size, visible pending orders, price movement and execution method all make the results different.
The same price difference does not equal the same actual transaction result. Imagine that both order books have a sell one of 100.20 and both have a target of buying $10,000 immediately. Path A has at least $10,000 of visible sell orders in a price range close to sell one; path B has only $3,000 in the same range, and the remaining amount will continue to hit higher sell price levels. The starting quote for both paths is the same, but the average transaction price may be different. This value is only used to explain variable relationships and does not correspond to any real exchange, underlying or available price.
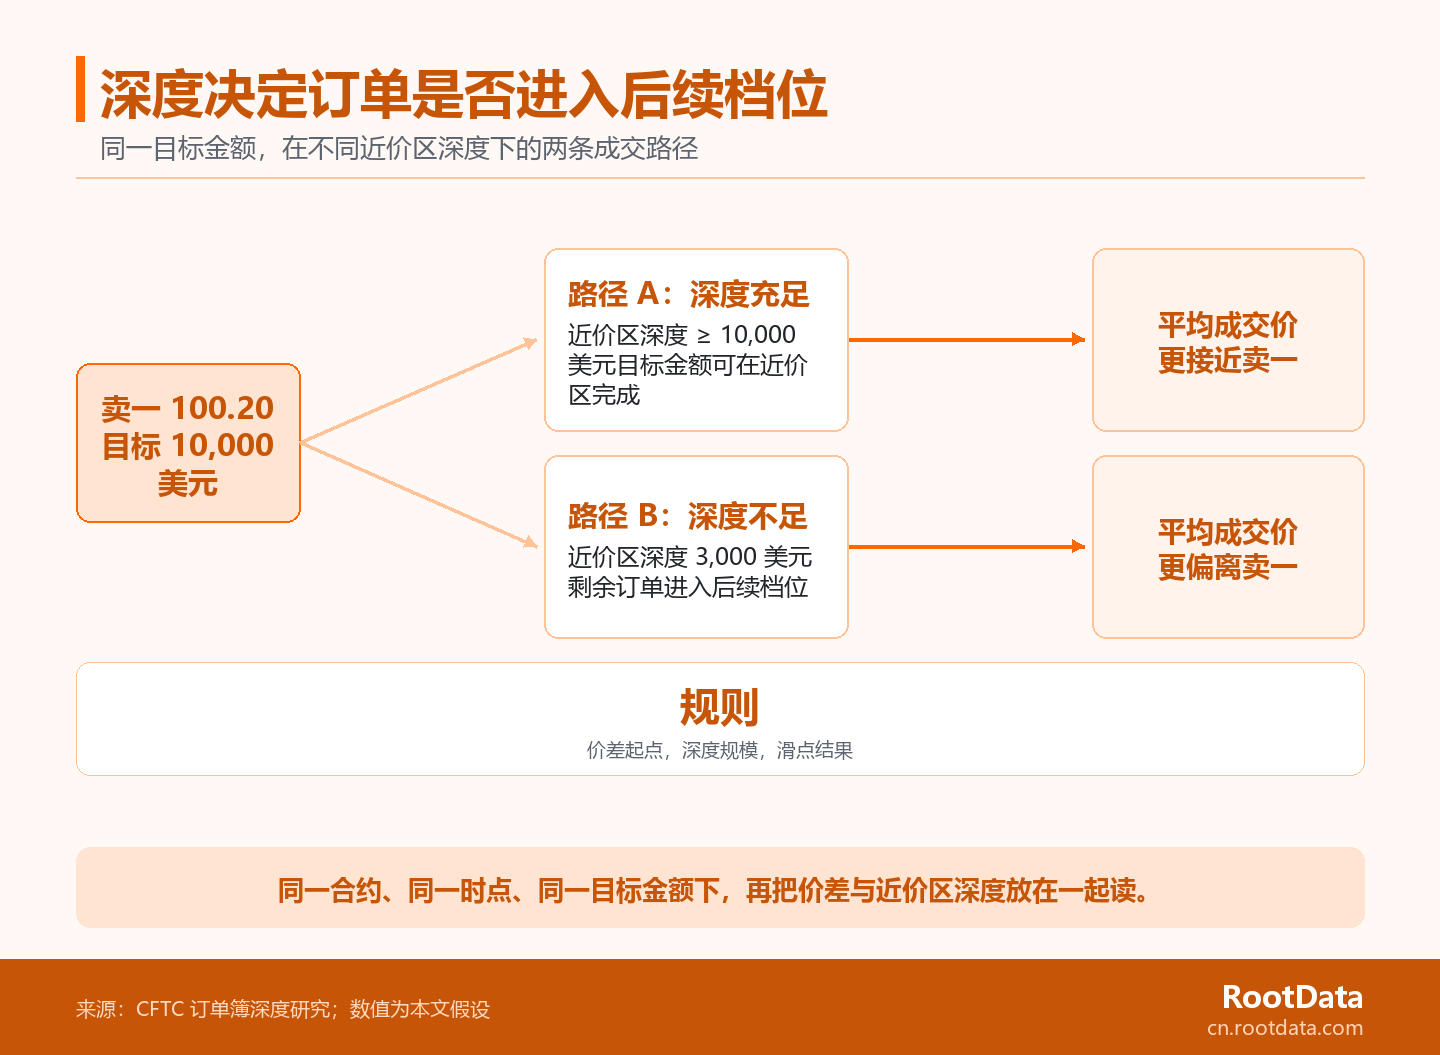
Here we can reconnect the four words: the spread describes the optimal quote from which the order starts, the depth describes how much scale the near-price zone can accept, the slippage records the deviation after the target order is completed, and the liquidity is a comprehensive judgment on the entire set of transaction conditions. If you only look at the selling price or the price difference, it is easy to miss whether the order needs to continue to "eat" to the subsequent position.
Why neither trading volume nor static depth can be concluded independently
High trading volume does not mean it is easier to trade at this moment. In its testimony on market liquidity, the CFTC pointed out that when high trading volumes are accompanied by significant price changes, trading volume cannot simply be regarded as sufficient evidence of liquidity; spreads and order book depth also need to be looked at together.View related instructions. Trading volume records transactions that have already occurred and cannot directly replace the visible supply at prices near the current moment.
Static depth does not mean the order book will be filled at the same rate. CFTC’s research specifically distinguishes between static order book depth and order filling speed: the former can show the visible pending orders at a certain moment, while the latter involves whether these pending orders will be quickly restored after being consumed.View depth boundaries in research. A single screenshot has reference value, but should not be understood as an ongoing commitment.
A safe comparison habit is to fix the timestamp, target or contract, order direction, target amount and price range, and then read the price difference, near price zone depth and transaction activity at the same time. This is not to draw conclusions about which one is better, but to avoid mixing data of different calibers.
Use the same ruler to read four indicators when comparing stock contract exchanges
The ranking field of RootData is suitable for comparison of the same caliber and is not a guarantee of specific transactions.RootData’s Equity Derivatives Ranking ExplainedComparison fields such as liquidity, spreads, fees and contract coverage are defined. Reading these fields at the same point in time can help establish a research framework; specific orders still need to be based on the contract page and order book at that time.
- Fix the object first:Compare identical underlyings, contract types and pricing methods.
- Refix time:The spread and depth will change, so try to use data at the same time point.
- Bring in the target size:Put the amount or quantity you plan to observe into the depth of the near price zone, instead of just looking at selling one or buying one.
- Finally look at the results:Group fields such as spread, depth, activity and fees together without drawing conclusions from any single field.
When you need to put these conditions back into the horizontal data page, you canView RootData Equity Derivatives Trading Platform Ranking. RootData is a Web3 asset data platform, not an exchange, broker, issuer, custodian or investment advisor; the ranking page is used for data research and condition comparison and does not replace the verification of specific transaction conditions.
FAQ
The following questions only supplement the indicator boundaries that have not yet been expanded upon in this article.
Does high liquidity mean there will be no slippage?
Not necessarily, liquidity is a description of the tradability of the market as a whole, and slippage still depends on the order size, visible depth and price changes at the time. Even in a more liquid market, when the scale becomes larger, the quotation changes faster, or there are insufficient pending orders in the near price area, the actual transaction may deviate from the starting quotation. Also distinguish whether you are looking at a small order or a larger order that needs to span multiple ticks. Understanding "good liquidity" as a comparative condition rather than a guarantee of a single transaction is more consistent with the meaning of these indicators.
What is the difference between trading depth and trading volume?
The trading depth looks at the number of pending orders at prices near a certain point in time, and the trading volume looks at the transactions that have been completed in the past period of time. The former is closer to "the current visible undertaking space", and the latter is closer to "how many transactions have just occurred." The two can complement each other, but they cannot replace each other. In particular, historical trading volume cannot be used to directly infer the scale that the current order book can undertake. If comparing different exchanges, the two types of data should also correspond to similar time windows to avoid mixing historical cumulative values with instant snapshots.
The price difference is very small, why may the actual transaction price still deviate?
Because a small price difference only shows that the best buying and selling quotations are closer, it does not mean that the quantity that can be accepted at that price range is sufficient. When the target order exceeds the visible depth of the near price zone, the remaining part may hit subsequent price levels, and the final average transaction price will be different from the sell one or buy one initially seen. Quote changes before the order enters the market may also increase deviations. When comparing, the target amount and price range should be placed in the same set of conditions as the spread.
How should RootData's ±2% liquidity field be understood?
Think of it as an observation of liquidity within a range around the price at that time, and compare it with spreads, contracts and other fields at the same point in time. It can help readers judge the visible size of the near price zone, rather than a commitment to the inevitable transaction cost of any order. If you want to check a specific product, you need to go back to the contract page of the corresponding exchange and the current order book, and confirm whether the page time, contract size and order direction are consistent with the comparison target.