
Overnight, the U.S. stock market crashed: a reflexive storm triggered by a $100 billion "runaway."
On Thursday, Goldman Sachs' phone lines were about to explode.
"The level of pain is extremely high."
This was a line from Goldman Sachs' top stock trader John Flood in a report sent to clients on Thursday. His phone, in his own words, was "exploding."
The Nasdaq 100 index fell 6.4% on Thursday, evaporating about $2.3 trillion in market value in a single day, marking the largest single-day drop since March 2020. The S&P 500 dropped 4.4%, and the Philadelphia Semiconductor Index plummeted 12%. The "fear index" VIX soared 70%, and Nvidia's gains for the year were completely wiped out, with SanDisk crashing 22% in a single day.
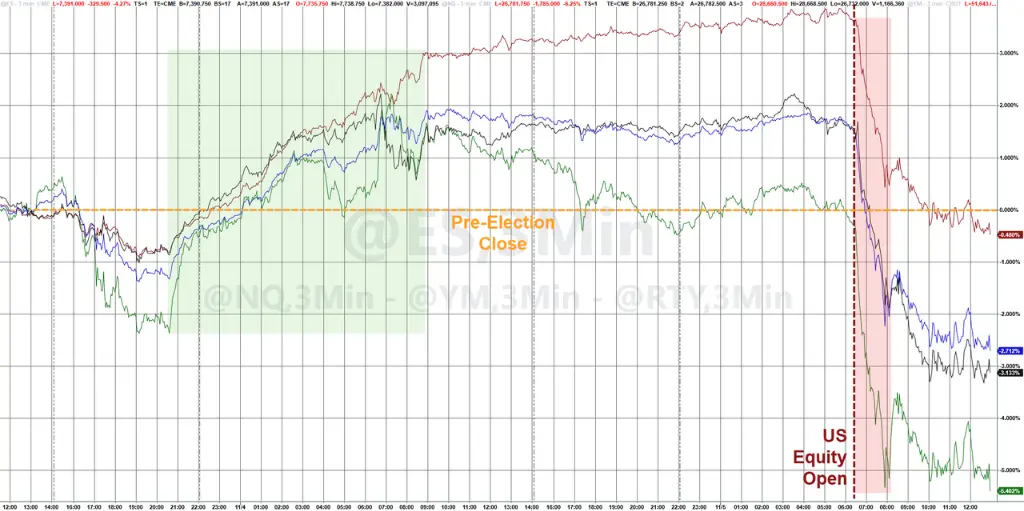
The immediate trigger for this crash was the Democratic Party's sweeping victory in the midterm elections. Goldman Sachs quickly warned that this "blue tsunami" would lead to about 45% of U.S. planned data center expansion capacities facing a pause—putting a question mark on the core narrative supporting AI tech stock valuations overnight.
However, the severity of the market's turmoil far exceeded what could be explained by the policy shock alone.
Charlie McElligott, a derivatives strategist at Nomura Securities, provided another layer of explanation in a report released during Thursday's trading session—this crash was partly caused by "the smartest group of people" stepping on the gas themselves.
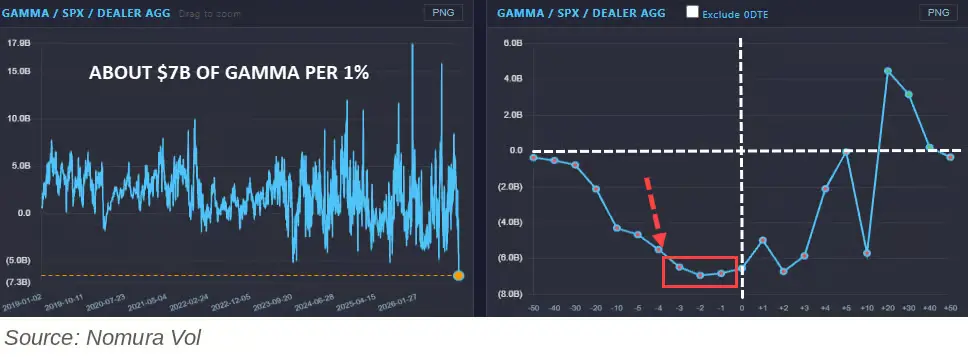
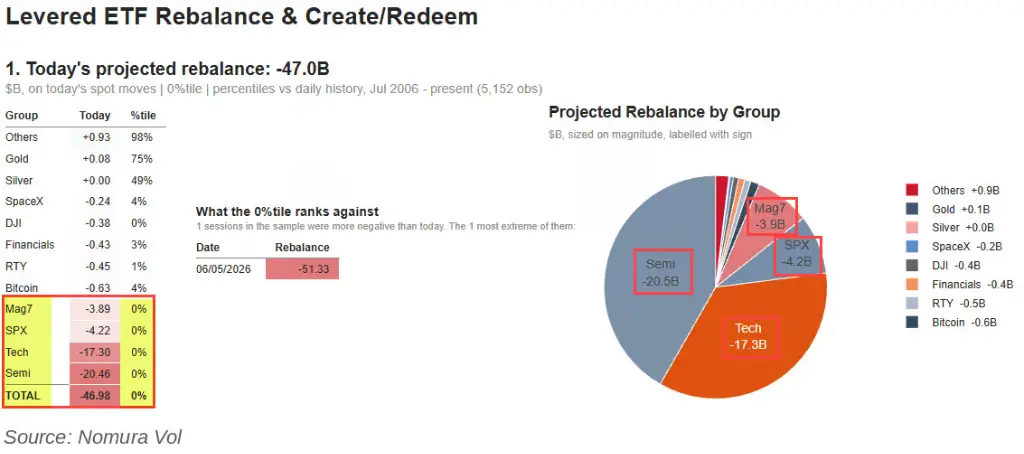
McElligott described a market paradox: during Thursday's trading session, when Morgan Stanley calculated a $52 billion forced sell-off before the close at noon, and the entire Wall Street was aware of it, everyone tried to sell early and buy back at lower points, resulting in the runners themselves becoming the force driving the decline. He warned that if the usual "low point between 2-3 PM followed by a rebound" did not occur, the runners would also become the force driving the decline. Indeed, the close that day was disastrous. With leveraged ETFs at $47 billion, volatility control funds at $61 billion, and dealer negative gamma, total mechanical selling pressure exceeded $100 billion, and it would continue into Friday.
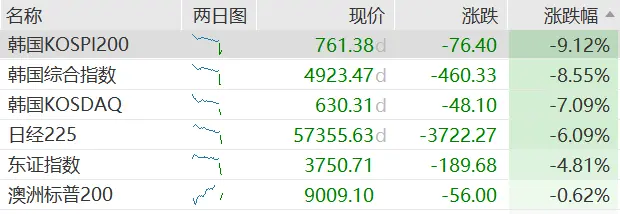
And today, in the Asia-Pacific markets, the crashes in South Korea and Japan are answering this question.
A $100 billion time bomb, known to all of Wall Street
To understand McElligott's logic, one must first grasp a mechanism.
There is a type of product in the market called leveraged ETFs, such as "2x long Nasdaq." They must do one thing before the market closes each day: rebalance their daily gains and losses back to the target leverage ratio. When the market drops significantly, this means they must sell a large amount of stocks before the close—the worse the drop, the more they sell; this is passive, mechanical, and unavoidable.
Another type is called volatility control funds (Vol Control), which systematically reduce stock positions when market volatility spikes—also mechanical, and typically executed with a one to two-day lag.
On Thursday, these two forces combined to create a staggering scale.
Morgan Stanley's derivatives team calculated at noon on November 5 that, assuming prices remained at the level of 1 PM, the forced sell-off from leveraged ETFs before the close would amount to about $52 billion. The semiconductor sector alone would account for $21 billion, and the Nasdaq 100 would take another $15 billion.
McElligott provided slightly lower numbers, but they were still shocking: leveraged ETFs at about $47 billion, the second-largest single-day rebalancing scale in Nomura's database, only behind the $51.3 billion on June 5 of this year. He added that this sell-off was "particularly painful" because 86% of the assets were concentrated in tech and AI-related stocks.
Adding about $61 billion in volatility control fund sell orders, along with approximately $7 billion in selling pressure from dealer negative gamma for every 1% drop, the total mechanical supply in the market easily exceeded $100 billion.
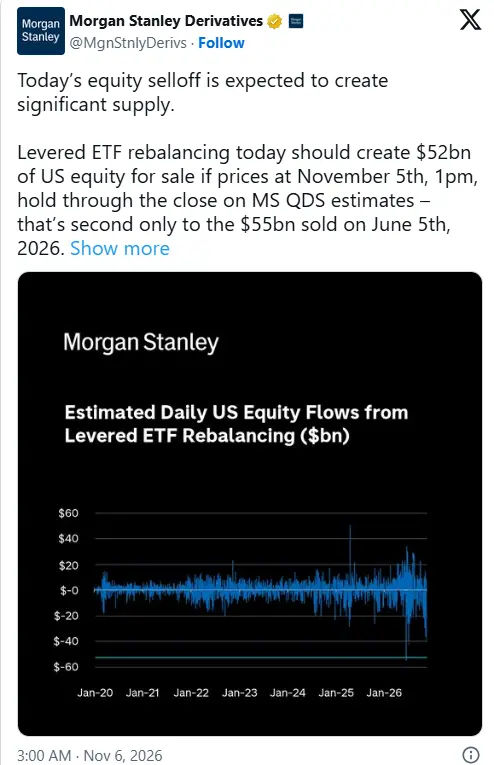
The key characteristic of these numbers is that they can be calculated in advance.
After Morgan Stanley calculated the $52 billion figure at noon, in McElligott's words, "on Wall Street, no information can remain confidential for more than 45 minutes"—this number quickly became "known to all of Wall Street."
The smart money's calculation: sell early, wait for a low point, buy back
Knowing about this mechanical sell-off, what was the reaction of traders?
McElligott stated that active traders facing this type of mechanical flow usually try to "run ahead."
The logic is simple: since there will be a wave of large-scale passive selling before the close, I will sell now and buy back at a lower price after it crashes.
Moreover, this strategy has been effective recently. McElligott pointed out in his report that on several recent trading days with "large single-day volatility," the market often forms a daily low between 2 PM and 3 PM Eastern Time, after which the runners and hedgers begin to reverse, take profits, and close positions, pushing the market to rebound before the close, ultimately resulting in a closing price higher than the extreme implied by the anticipated mechanical sell-off.
Just last Thursday, McElligott had just reminded the market that "it's happening again"—at that time, leveraged ETFs faced a $35 billion sell order, and the market also exhibited the classic structure of "low point between 2-3 PM + close rebound."
During the market crash in South Korea in June, the U.S. stock market followed a similar script.
On the day of the tariff suspension in April, this mechanism operated in reverse: McElligott calculated the largest historical +$34.3 billion buy rebalancing before the close, with runners buying in advance, ultimately driving the market to surge.
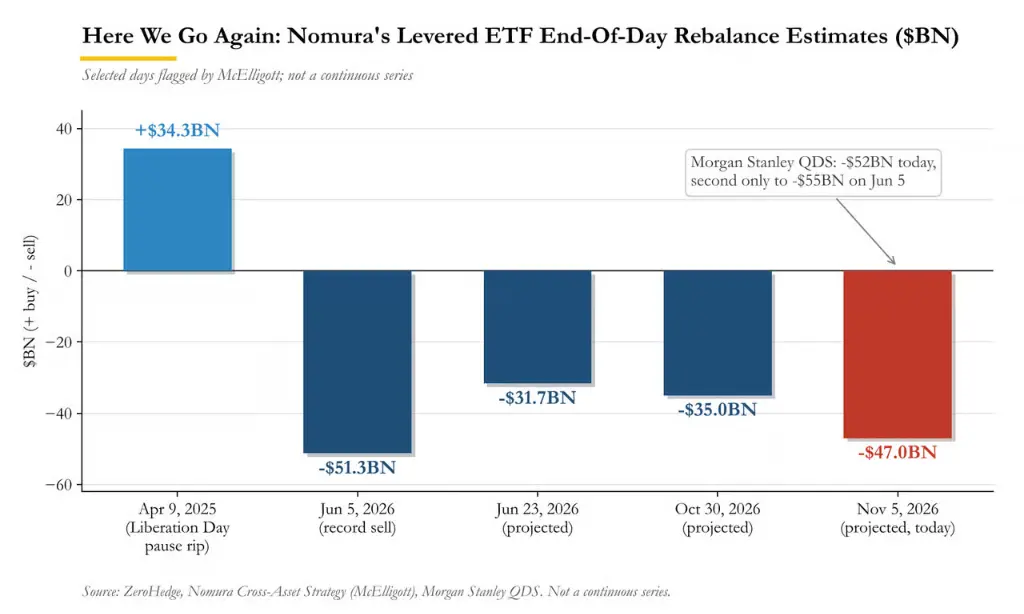
So on Thursday, when Morgan Stanley's $52 billion figure spread throughout the street at noon, every trader who knew this number was calculating the same thing: sell now, wait for the low point between 2-3 PM, then buy back.
The reflexivity trap: the cavalry is the one selling
Then McElligott wrote down the chilling concern in his report: "What if that 'hypothetical low point between 2-3 PM followed by a rebound' does not occur at all?"
Clearly, the terrifying aspect now is that these numbers are so large that 'if' we do not see that almost taken for granted tail-end 'low point followed by a rebound' (a rebound of one or two percentage points from the low), and cannot rebound in the 'standard TWAP' window between 2 PM and 3 PM, but instead create new lows... and after a feint at the assumption that the market "will rebound in the last hour," it closes at the lowest point.
This is the core of the reflexivity paradox.
When everyone knows the same script and acts according to the script simultaneously, the script itself becomes ineffective.
The $100 billion mechanical sell-off that should have concentrated before the close was dispersed throughout the day by proactive traders who "ran ahead"—these runners themselves became the force driving the market down.
At the same time, the sell orders from volatility control funds have a one to two-day lag—Thursday's crash will trigger these funds to continue selling on Friday. McElligott wrote that the selling volume corresponding to the drop at 3 PM that day was about $61 billion, and if the drop expanded to 10%, this number would swell to $70 billion.
More deadly is: when all the runners have sold, waiting for "that low point"—who will take the next position?
McElligott used a meme in his report to describe this scene: everyone is sitting in chairs, waiting for the same rebound—but there aren't enough chairs.

ZeroHedge analyzed and summarized:
"Sometimes the cavalry arrives at 3 PM. Sometimes, the cavalry is the one selling."
On Thursday, the cavalry did not arrive. The market closed at the lowest point of the day: the Nasdaq 100 fell 6.4%, and the S&P 500 fell 4.4%.
The stampede scene: the best trade of the year was wiped out in 48 hours
Before the reflexivity mechanism exploded, there was another powder keg waiting for a fuse in the market.
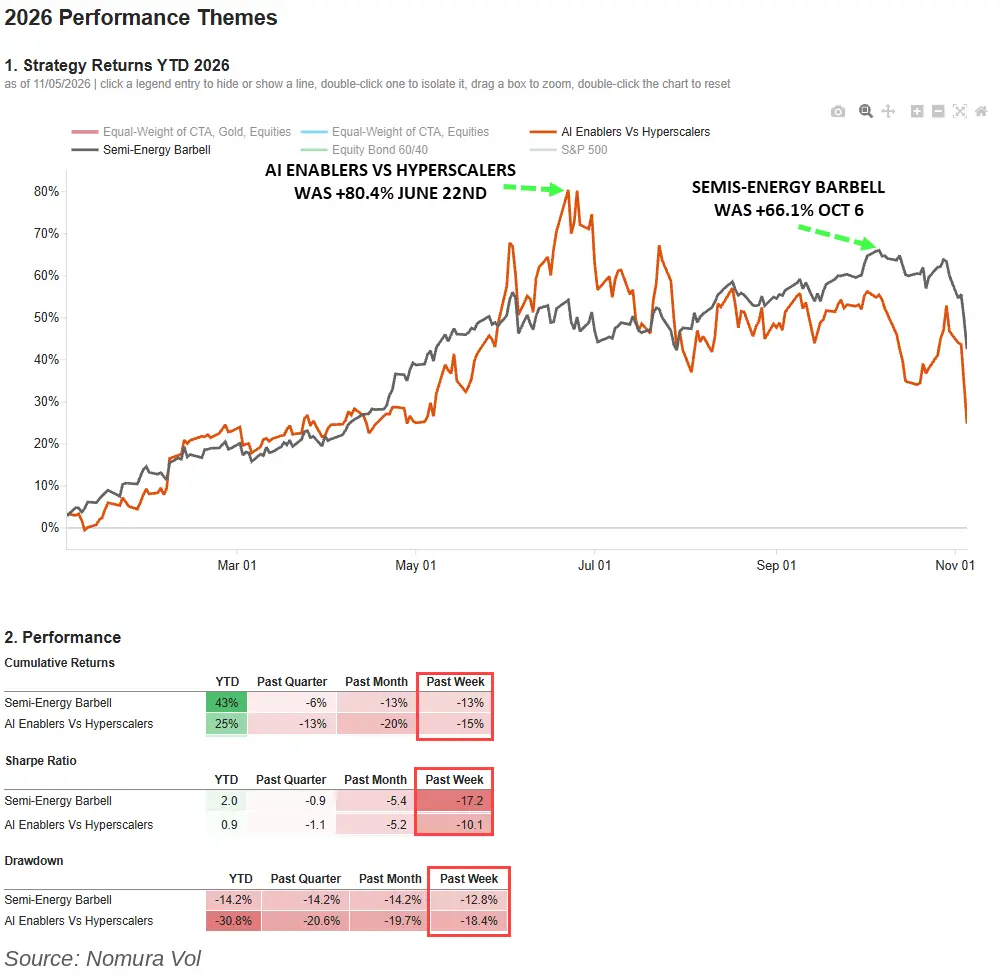
McElligott referred to this year's "best trade on Wall Street" as the "semiconductor-energy dumbbell strategy"—going long on semiconductors (benefiting from AI computing power demand) while also going long on energy (geopolitical risk premium + inflation hedge). This strategy had accumulated returns of up to 66% a few weeks ago, with a Sharpe ratio of 3.3.
Then, in the past 48 hours, both legs were swept away simultaneously:
Energy: down 10.2% this week.
Semiconductors: down 13.1% this week.
The weekly Sharpe ratios were -17.2 and -10.1, respectively.
The collapse of the energy leg came from the market's repricing of the situation in Iran—McElligott observed that the White House signaled a possible "softening" on the Iran issue, and the war premium was quickly withdrawn, with Brent crude oil experiencing its largest drop since the pandemic began this week.
The collapse of the semiconductor leg stemmed from market concerns about data center regulation after the Democratic Party's sweep of Congress.
With both directions collapsing simultaneously, funds holding the dumbbell strategy faced not just losses but forced liquidations. The mindset described by McElligott of "preserving this year's gains and surviving into next year" was completely shattered at this moment.
Walleye Capital announced that day it would return client funds and fire the head of its equity department, stating it was the worst month since the pandemic began. Goldman Sachs trader John Flood described how long positions in institutions "fell back into a stalemate," with massive cloud computing positions bought during the previous day's rebound being quickly dumped, "and currently, no buyers have stepped in."
The abnormal trading volume at the ETF level confirmed the level of panic: SPY's trading volume was 160% higher than the 20-day average, QQQ was up 100%, and the semiconductor ETF SMH was up 150%.
According to Jai Malhi, a senior equity strategist at Vanda Research, the selling scale of retail investors on Thursday "is expected to become the largest retail liquidation since the end of July last year."
Bonds Are Being Short-Squeezed, Another Leg Is Bleeding
There is another overlooked leg that is simultaneously breaking.
CTA trend funds have accumulated a large number of short positions in bonds this year, which is part of the "short bonds/long inflation" trade and is a hidden complement to the barbell strategy.
The stock market crash triggered a rush of safe-haven buying into the bond market, causing U.S. Treasury prices to surge, forcing bond shorts to cover. McElligott's calculations show that CTAs are facing a "massive short squeeze" in the bond direction: if U.S. Treasury prices rise another 2%, it will trigger about $225 billion in forced buying of global bonds, including approximately $48.5 billion in U.S. 2-year bonds, about $69.5 billion in Eurozone 2-year bonds, and about $23.9 billion in Japanese 10-year bonds.
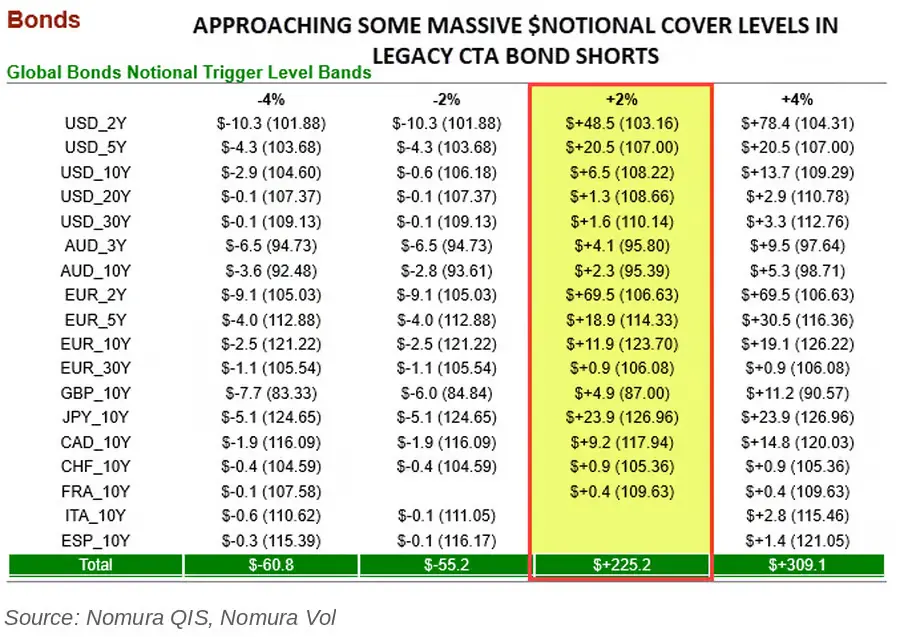
This means that the short squeeze of bond shorts is also becoming a force driving the bond market up, further compressing stock longs—another reflexive cycle.
The Crash Is Not Over: Lagging Selling Pressure on Friday
The close on Thursday does not mean the end of this mechanical selling pressure.
The execution of volatility control funds has a lag. McElligott wrote that the market decline on Thursday will continue to trigger sell orders from such funds on Friday—"Today's decline is further loading into the queue."
UBS's estimates are more direct: its risk control rebalancing model shows that if the S&P 500 falls by 2%, the selling scale of systematic funds will reach $95 billion to $105 billion.
The Asian markets are already answering this question.
On Friday morning, the Korea Composite Stock Price Index plummeted by 8.8%, falling below the 5000-point mark and triggering a circuit breaker—this level was once viewed by South Korean President Lee Jae-myung as a milestone for economic recovery, but has now quickly fallen below it. The Nikkei 225 index dropped nearly 5.8%, falling below 60,000 points during the session, down more than 20% from its June high, officially entering a technical bear market.
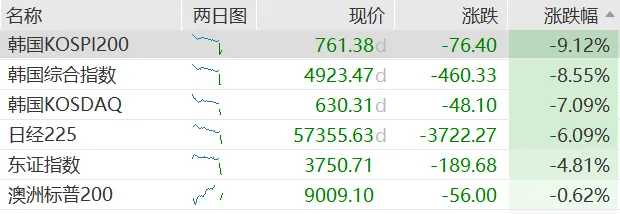
U.S. stock futures saw a slight rebound in the Asian morning, with Nasdaq futures briefly turning positive, indicating that some investors are starting to buy on dips. However, UBS warns that the pressure from systematic selling has not yet been fully released.
There is another variable on Friday: the U.S. non-farm payroll report for October will be released that day, with market consensus expecting an increase of 59,000 jobs and an unemployment rate remaining at 4.2%. The direction of the data will determine whether this round of adjustment can find a breathing window.
Risk Warning and Disclaimer
The market has risks, and investment requires caution. This article does not constitute personal investment advice and does not take into account the specific investment goals, financial situation, or needs of individual users. Users should consider whether any opinions, views, or conclusions in this article are suitable for their specific circumstances. Investing based on this is at your own risk.