


Say Goodbye to "Air" Investments: Use These 6 Key Indicators to Help You Choose Winning Projects
Jan 08, 2026 18:30:49


Author: ++Patrick Scott | Dynamo DeFi++
Compiled by: Shenchao TechFlow
In the past, the analysis of crypto assets mostly revolved around charts, hype cycles, and narratives. However, as the industry matures, actual performance becomes more important than empty promises. You need a filter to help you extract truly valuable signals from the overwhelming information.
Fortunately, this filter already exists, and it is called Onchain Fundamentals.
Onchain Fundamentals provide structural advantages for DeFi (Decentralized Finance) compared to traditional finance (TradFi). This is not only one of the many reasons why "DeFi will prevail," but also a core concept that everyone looking to invest in this industry must understand.
For the past four years, I have immersed myself in the study of DeFi data metrics, initially as a researcher and later joining the DefiLlama team. This article summarizes some of the most useful analytical frameworks I have learned during this time, hoping to help you start using these tools.
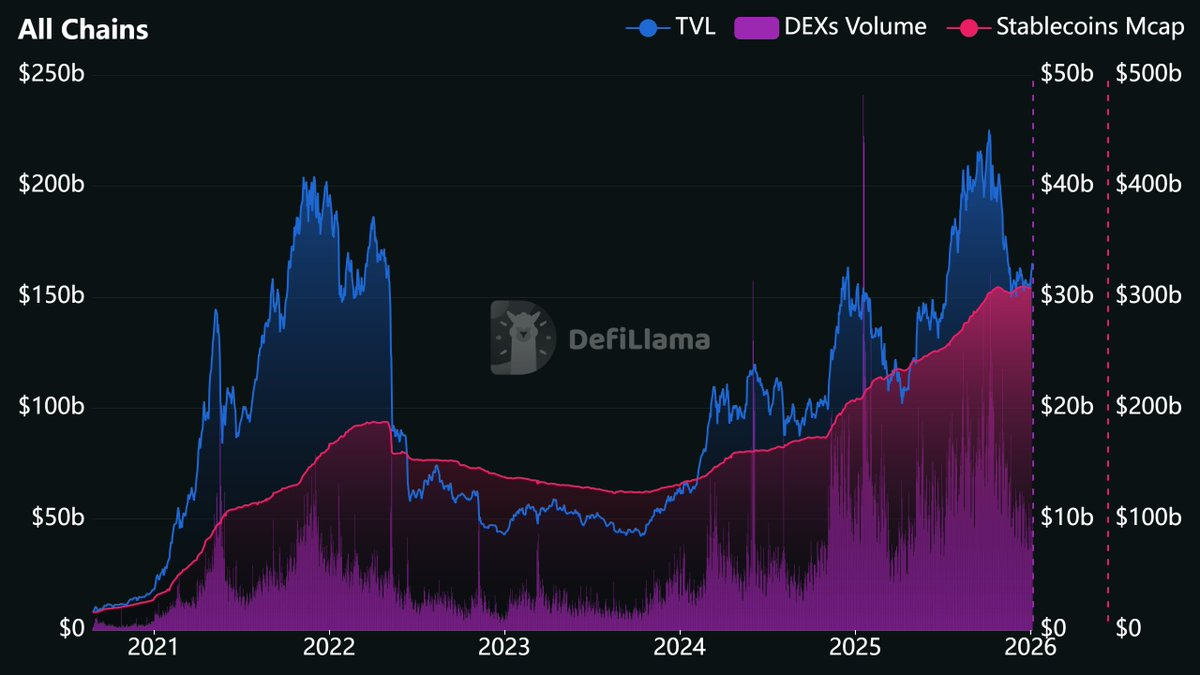
Source: ++https://defillama.com/?stablecoinsMcap=true\&dexsVolume=true++
Why Are DeFi Metrics Important?
Onchain data is not just a breakthrough in assessing crypto assets; it is a revolution in the entire financial data field.
Consider how traditional investors evaluate companies: they have to wait for quarterly earnings reports to be released. Now, there are even proposals to change the frequency of earnings reports from quarterly to semi-annually.
In contrast, the financial data of DeFi protocols is available in real-time. Websites like DefiLlama update relevant data daily or even hourly. If you want to track revenue by the minute, you can even query blockchain data directly (though overly granular data may not be very meaningful, you do have that option).
This is undoubtedly a revolutionary breakthrough in transparency. When you buy shares of a publicly traded company, you rely on financial data released by management after being audited by accountants, which often has a delay of weeks or even months. When you evaluate a DeFi protocol, you are directly reading transaction records that occur in real-time on an immutable ledger.
Of course, not every crypto project has fundamental data worth tracking. For example, many "meme coins" or "airdrop projects" with only a white paper and a Telegram group may not benefit much from fundamental analysis (although other metrics like the number of holders may provide some reference).
But for those protocols that generate fees, accumulate deposits, and distribute value to token holders, their operations leave data traces that can be tracked and analyzed, often before market narratives form.
For instance, Polymarket's liquidity has been growing for years, a trend that began to show before prediction markets became a hot topic.
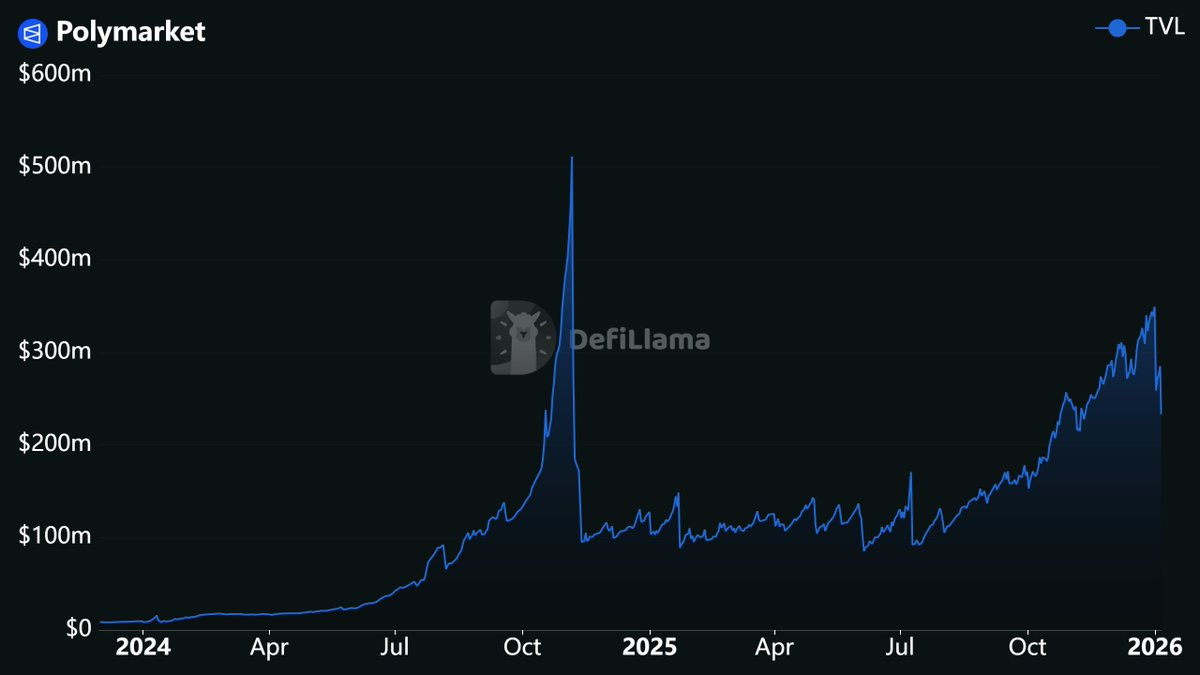
Source: ++https://defillama.com/protocol/polymarket++
The explosive price growth of HYPE tokens last summer stemmed from their sustained high revenue performance.
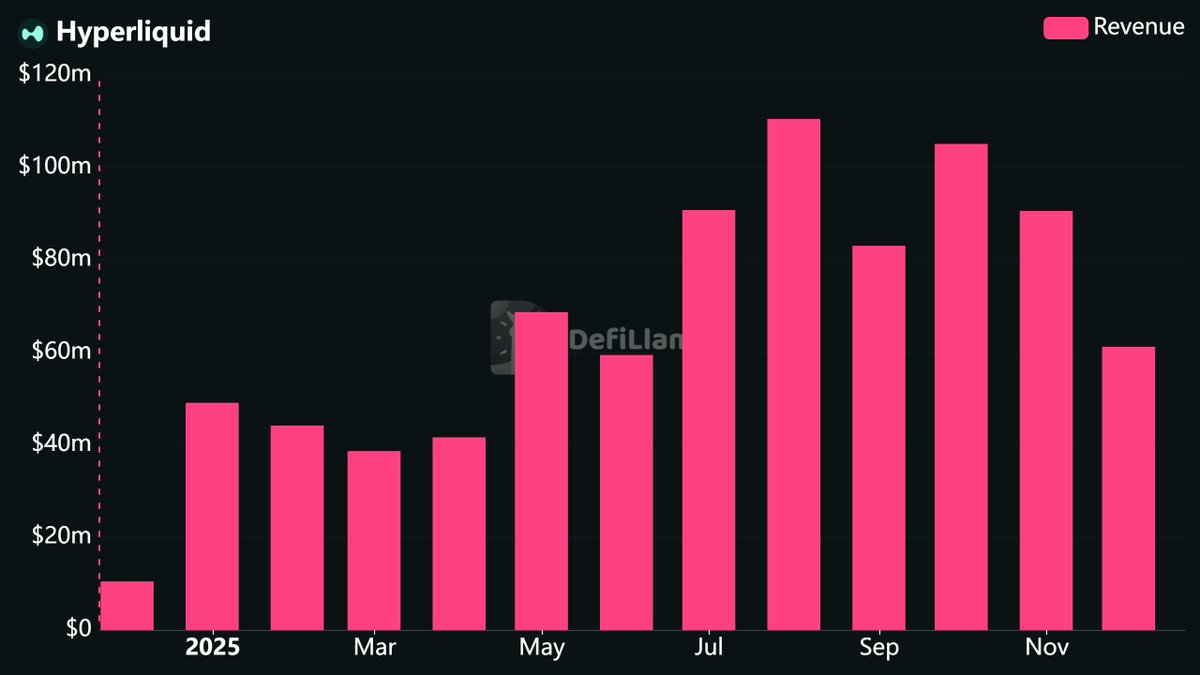
Source: ++https://defillama.com/protocol/hyperliquid?tvl=false\&revenue=true\&fees=false\&groupBy=monthly++
These metrics have long hinted at future directions; you just need to know where to look.
Core Metrics Analysis
Let’s start with the core metrics you need to understand for DeFi investment.
TVL (Total Value Locked)
TVL measures the total value of assets deposited in a protocol's smart contracts.
- For lending platforms, TVL includes collateral and provided assets.
- For decentralized exchanges (DEX), TVL refers to the deposits in liquidity pools.
- For blockchain networks, TVL is the total value locked across all protocols deployed on that network.
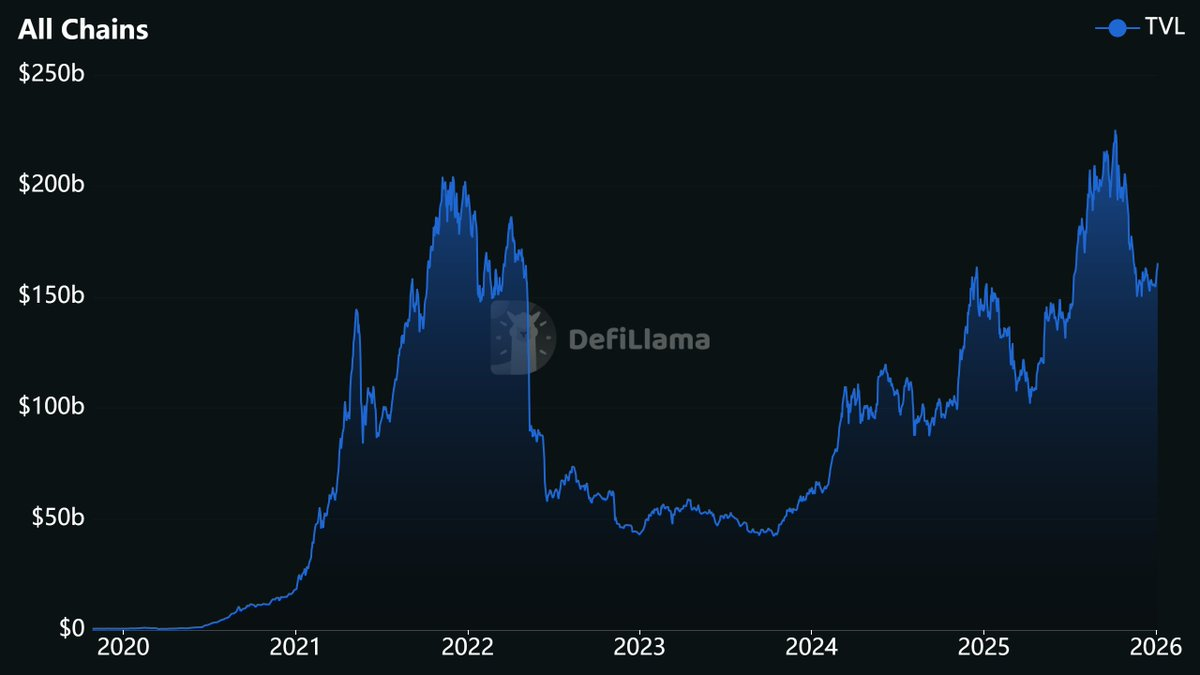
Source: ++https://defillama.com/++
In traditional finance (TradFi), TVL is similar to Assets Under Management (AUM). Hedge funds report AUM to showcase the total amount of funds entrusted to them by clients. TVL serves a similar purpose; it reflects the total amount of funds users have deposited into the protocol, indicating the level of trust users have in that protocol's smart contracts.
However, over the years, the TVL metric has also faced criticism, some of which is valid.
- TVL does not measure activity levels. A protocol may have billions of dollars in deposits but generate almost no fees.
- TVL is highly correlated with token prices. If the price of ETH drops by 30%, the TVL of all protocols holding ETH will also decrease by the same percentage, even if no actual withdrawals occur.
Since most DeFi deposits are volatile tokens, TVL can be easily affected by price fluctuations. Therefore, astute observers will combine USD Inflows with TVL to differentiate between price changes and actual deposit activity. USD Inflows are calculated by measuring the balance changes of each asset over two consecutive days (multiplied by price) and summing them up. For example, a protocol that is 100% locked in ETH will see its TVL drop by 20% if the price of ETH falls by 20%, but its USD Inflows will be $0.
Nonetheless, when TVL is presented in both USD and token terms and used in conjunction with activity or productivity metrics, it still holds value. TVL remains an important tool for measuring protocol trust and the overall scale of DeFi. Just don’t mistake it for a complete assessment standard.
Fees, Revenue, and Holders Revenue
In DeFi, the definitions of these terms differ from traditional accounting, which may be confusing.
- Fees: From the user's perspective, fees refer to the costs you incur when using the protocol. For example, when you trade on a DEX, you need to pay a trading fee. This fee may entirely belong to liquidity providers or partially to the protocol. Fees represent the total amount paid by users, regardless of where it ultimately goes. In traditional finance, this is akin to Gross Revenue.
- Revenue: Revenue refers to the share of earnings retained by the protocol. In other words, how much of the total fees paid by users does the protocol actually keep? This revenue may flow to the protocol's treasury, team, or token holders. Revenue does not include fees allocated to liquidity providers and can be viewed as the protocol's Gross Income.
- Holders Revenue: This is a narrower definition that only tracks the portion of income distributed to token holders through buybacks, burn fees, or direct staking dividends. In traditional finance, this is similar to a combination of dividends and stock buybacks.
These distinctions are crucial in valuation. Some protocols may generate significant fees, but if nearly all fees are allocated to liquidity providers, the final revenue may be meager.
DefiLlama currently publishes complete revenue reports for many protocols. These reports are automatically updated based on onchain data, breaking down revenue into different items and redefining these metrics in standard accounting language.
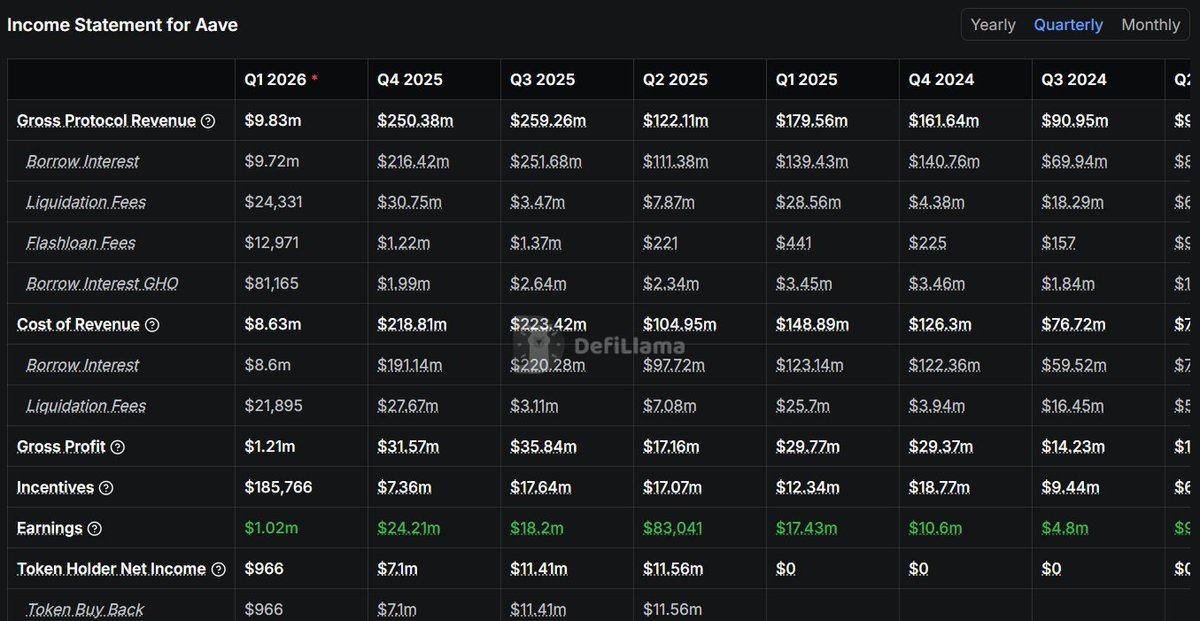
Source: ++https://defillama.com/protocol/aave++
These revenue reports also come with visual charts showing the flow of funds, illustrating the entire process from users flowing into the protocol and then being distributed to various stakeholders. If you want to delve into the economic models of specific projects, this information is well worth exploring.
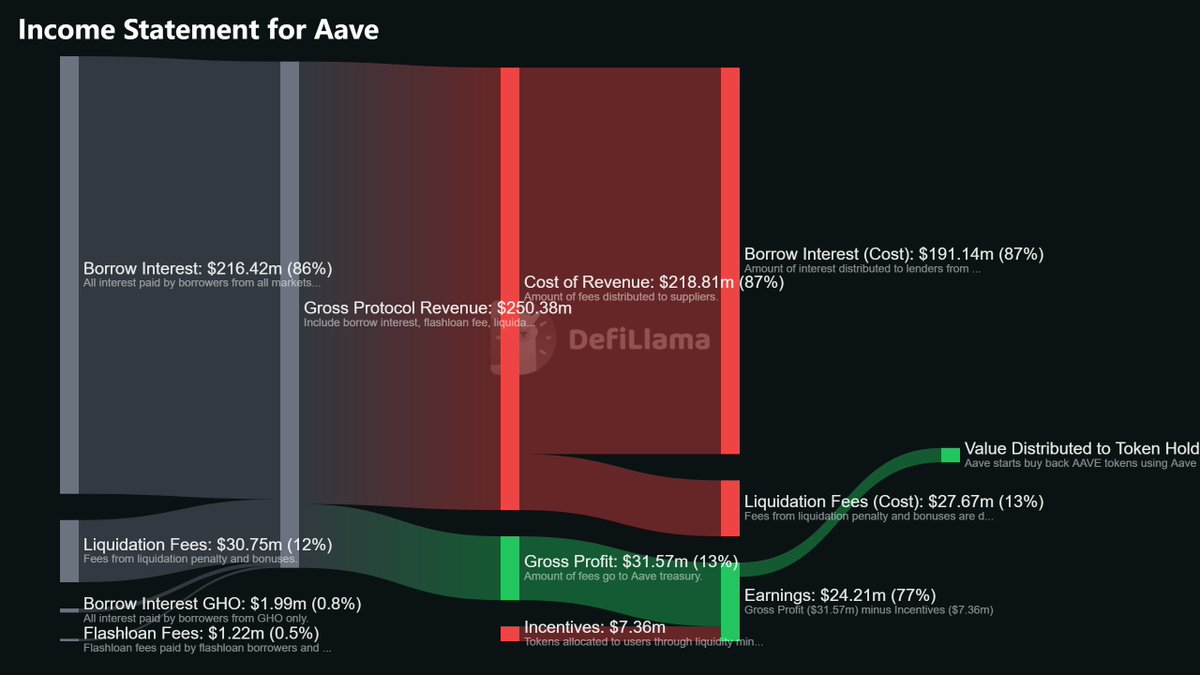
Source: ++https://defillama.com/protocol/aave++
Volume
Volume is used to track the scale of trading activity.
- DEX Volume: Counts all trades on decentralized exchanges (DEX).
- Perpetual Contract Volume: Counts the total volume of trades on all perpetual contract trading platforms.
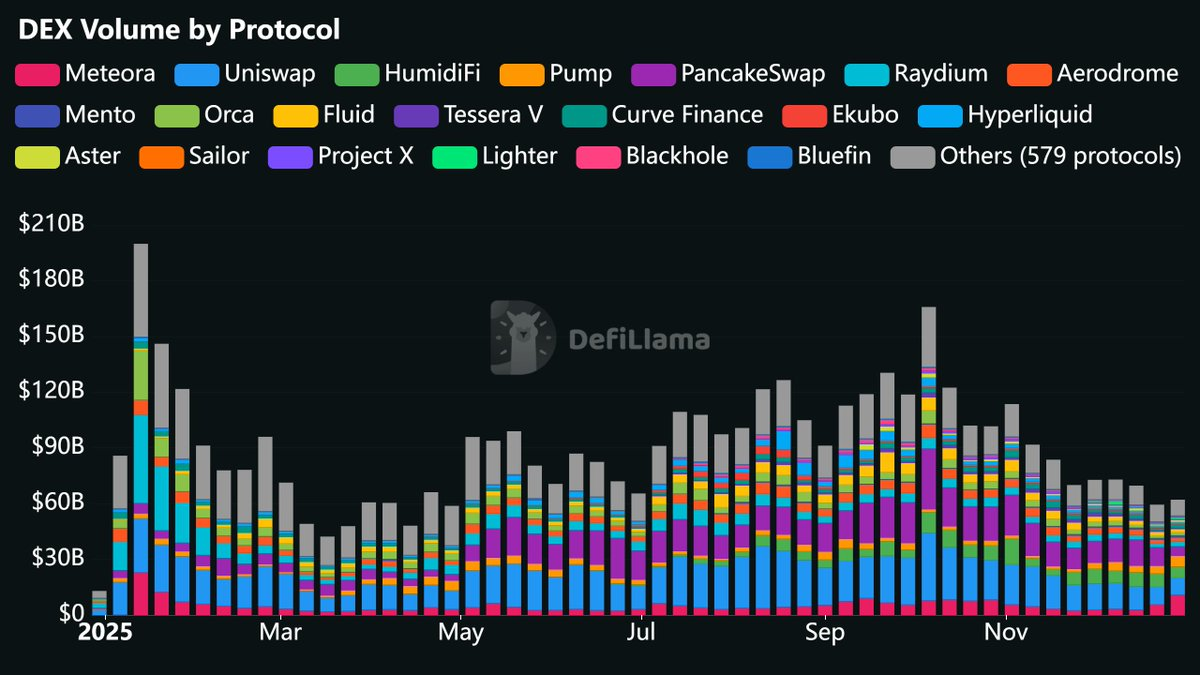
Source: ++https://defillama.com/pro/97i44ip1zko4f8h++
Volume is a key indicator of overall participation in the crypto market. When people actively use digital assets, they trade. A surge in volume is often associated with changes in market interest, whether it’s a euphoric rise or a panic sell-off.
Compared to previous cycles, perpetual contract volume has significantly increased. In 2021, the presence of perpetual contract exchanges was quite limited. Now, platforms like Hyperliquid, Aster, and Lighter are achieving daily trading volumes in the billions. Due to the rapid growth in this area, comparing it with historical data from the past is of limited significance. For instance, comparing current perpetual contract volume with data from 2021 only indicates that the field has expanded, without providing more valuable insights.
In a given category, the trend in market share is more important than absolute volume. For example, if the market share of a perpetual contract DEX grows from 5% to 15%, even if its absolute volume declines, it indicates an actual improvement in its market position. DefiLlama's custom dashboard library offers many market share charts worth checking out.
Open Interest
Open interest refers to the total value of derivative contracts that are open or not forcibly closed. For perpetual contract DEXs, open interest represents all positions that have not been closed or liquidated.
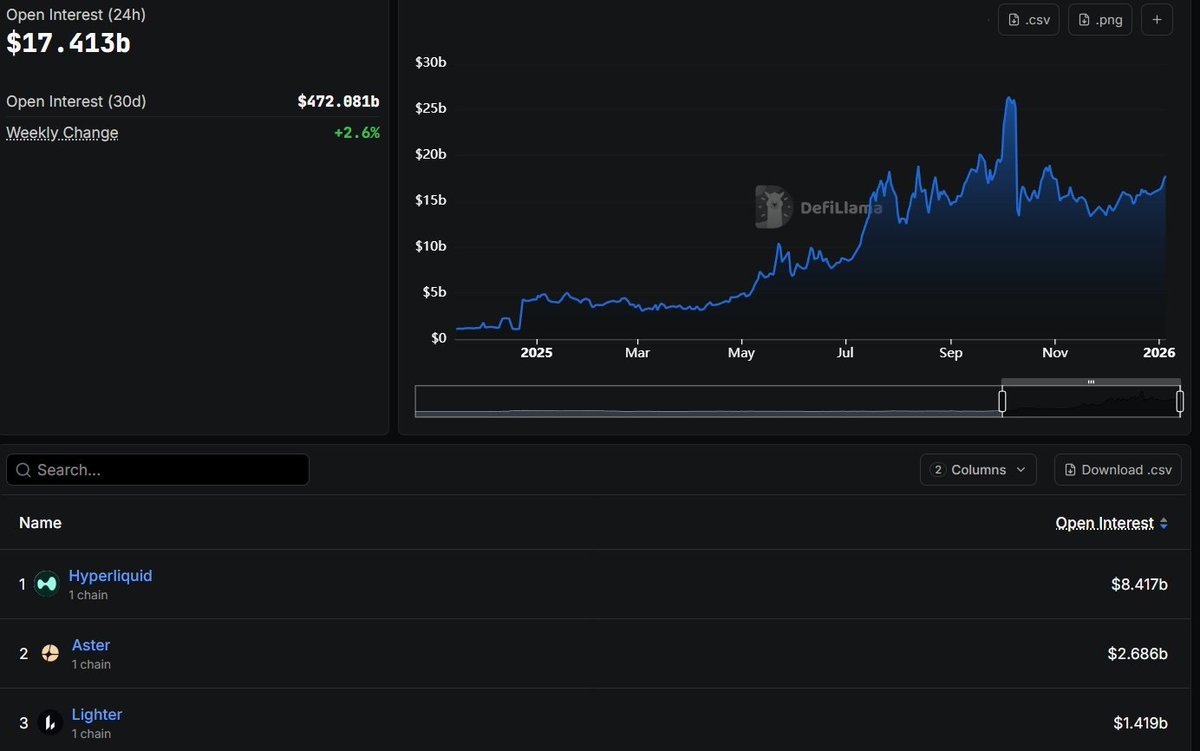
Source: ++https://defillama.com/open-interest++
Open Interest is an important indicator of liquidity on derivative platforms. It reflects the total capital deployed in currently active perpetual contract positions.
During periods of market volatility, this metric can collapse rapidly. A large-scale liquidation wave can wipe out open interest within hours. By tracking the recovery after such events, one can observe whether a platform can re-attract liquidity or if funds have permanently migrated to other platforms.
Stablecoin Market Cap
For blockchain networks, stablecoin market cap refers to the total value of all stablecoins deployed on that network.
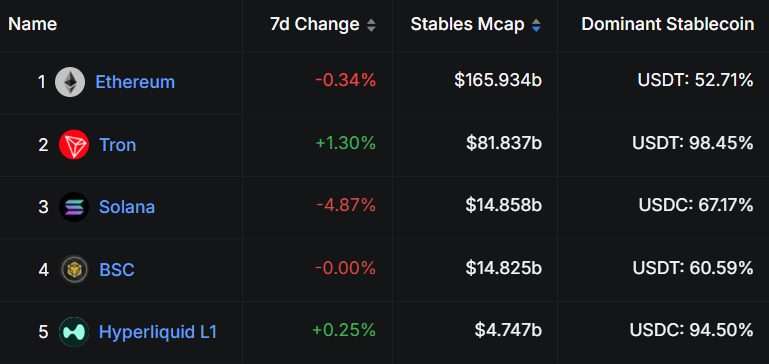
Source: ++https://defillama.com/stablecoins/chains++
Stablecoin market cap is an important indicator of capital inflow. Unlike TVL, which is affected by token price fluctuations, stablecoins represent the actual dollars (or dollar equivalents) that users have injected into the chain through cross-chain bridges. For example, when the stablecoin market cap on a chain grows from $3 billion to $8 billion, it means that $5 billion of real capital has flowed into that ecosystem.
Since October 2023, approximately $180 billion has flowed into the crypto market in the form of stablecoins. A portion of this inevitably enters DeFi, driving TVL growth, increasing volume, and generating fees. The flow of stablecoins is similar to capital inflows in a national economy; an increase in stablecoin supply indicates new funds entering, while a decrease indicates capital outflows.
App Revenue & App Fees
App revenue and app fees are chain-level metrics that account for the revenue and fees generated by all applications deployed on that chain, excluding stablecoins, liquid staking protocols, and gas fees.
I view it as the "GDP" of the blockchain, showcasing the scale of actual economic activity occurring within that ecosystem.
Revenue metrics are among the hardest data to fake, as they require users to genuinely spend funds. This makes it a high-signal indicator for assessing the activity level of the DeFi ecosystem.
It is important to note that you cannot base valuations solely on app revenue, as it is meaningless to value based on income that has no direct correlation to assets. App revenue and app fees are better suited for diagnosing whether a chain is growing rather than assessing its value.
How to Effectively Interpret These Metrics?
Understanding individual metrics is the first step, but to effectively utilize them, you need an analytical framework. I tend to use the following three-step analytical approach:
- Prioritize sustained, stable growth.
- Track both stock metrics and flow metrics simultaneously.
- Consider the impact of token unlocks and incentive mechanisms.
1. Prioritize Sustained, Stable Growth
Protocols that show a brief spike in revenue charts followed by a rapid collapse do not reflect sustainable value creation. I have seen countless protocols set revenue records in one week, only to vanish a month later.
What truly matters is stable growth over a longer time frame. For example, if a protocol's monthly revenue gradually increases from $500,000 to $2 million over six months, it indicates that its growth is sustainable. Conversely, if a protocol suddenly spikes to $5 million in revenue one week but quickly drops to $300,000, it may just be a fleeting anomaly.
In the crypto industry, the passage of time is much faster than in traditional markets. Here, a month of sustained growth roughly equates to a quarter in traditional markets. If a protocol's revenue continues to grow over six months, it can be viewed as a company that has experienced six consecutive quarters of earnings growth. This performance is worth noting.
2. Track Stock and Flow Metrics Simultaneously
- Stock Metrics: Such as TVL (Total Value Locked), Open Interest, stablecoin market cap, treasury, etc., tell you how much capital is deposited in the protocol.
- Flow Metrics: Such as fees, revenue, volume, etc., tell you the actual activity level within the protocol.
Both are equally important.
Activity levels can be more easily faked. For example, a protocol can artificially inflate its trading volume through incentives or wash trading, and such temporary spikes are not uncommon. However, liquidity is much harder to manufacture. To get users to genuinely deposit funds and retain them long-term, the protocol must provide actual utility or offer attractive yields.
When evaluating any protocol, choose at least one stock metric and one flow metric for analysis. For example:
- For perpetual contract DEXs, you could choose Open Interest and Volume.
- For lending protocols, you could choose TVL and Fees.
- For blockchains, you could choose stablecoin market cap and App Revenue.
If both types of metrics show growth, it indicates that the protocol is indeed expanding. If only activity metrics are growing while liquidity stagnates, further analysis is needed, as there may be manipulation. If only liquidity is growing while activity metrics stagnate, it may indicate that deposits are primarily coming from a few "whales."
3. Consider Token Unlocks and Incentive Mechanisms
Token unlocks create selling pressure. A portion of the vested tokens released by the protocol each week will always be sold. If there is no demand from other sources to offset this selling, token prices will decline.
Before investing, check the token unlock schedule. A protocol with 90% of its supply in circulation has little future dilution pressure. In contrast, a protocol with only 20% in circulation and a large unlock coming in three months presents a completely different investment risk.
Similarly, if a high-revenue protocol issues more tokens in incentives than it earns from users, its high revenue figures may not look as impressive. DefiLlama tracks this through the "Earnings" metric, which deducts incentive costs from revenue. For example, a protocol may generate $10 million in revenue annually but issue $15 million in token rewards.
While incentives are an effective strategy for driving early protocol growth and are often necessary in the early stages of a protocol's lifecycle, they do create selling pressure that needs to be offset by other demand.
Latest News
ChainCatcher
Jan 14, 2026 22:44:36
ChainCatcher
Jan 14, 2026 22:42:05
ChainCatcher
Jan 14, 2026 22:36:46
ChainCatcher
Jan 14, 2026 22:32:38
ChainCatcher
Jan 14, 2026 22:31:40