


Is Bitcoin building a long-term bottom? — Observing the current stage from on-chain data
4월 10, 2026 15:08:58


Market Overview
In the past few months, the price of Bitcoin has continued to be under pressure after a high-level retreat. The current market divergence is not so much about how much the price has adjusted, but rather about the position of this round of decline in the cycle evolution: is it still in the clearing phase, or has it begun to enter the bottom-building phase? From an external environment perspective, global macro conditions have not yet provided substantial friendly support for risk assets: U.S. interest rates remain high, the liquidity environment is generally tight, and geopolitical disturbances and growth expectations are switching back and forth, keeping market risk appetite in a fragile state. In this context, although the price of Bitcoin has shown a significant adjustment, it cannot be simply judged whether it has entered a typical bear market bottom area based solely on the magnitude of the decline.
Compared to previous cycles, the uniqueness of this adjustment lies in the fact that the price movement is constrained by macro liquidity on one hand, while on the other hand, it is influenced by ETF fund inflows, an increase in institutional holdings, and changes in the chip structure. This has resulted in a certain resilience in Bitcoin's price performance, meaning that the price decline may not reach deeply undervalued areas as quickly as in past bear markets, but on-chain profit compression, loss realization, and chip redistribution may have already unfolded simultaneously. In other words, there may be a phase misalignment between the price level of "not having deeply declined" and the on-chain level of "clearing is progressing." This is also why, when judging the current market position, one cannot simply apply historical price ranges but must return to the on-chain structure itself.
Therefore, this article will not use short-term price fluctuations as the main basis but will start from on-chain data, focusing on three questions: First, has the overall profit level in the market significantly compressed? Second, is the loss chip completing its concentrated clearing? Third, are the chips beginning to transfer from high-cost, short-term holders to more stable long-term holders? Only when these three chains gradually close will the market be more likely to truly enter the long-term bottom-building phase. Based on this idea, the following will systematically position the current stage of Bitcoin by combining indicators such as MVRV, Entity-adjusted Realized Loss, SOPR, HODL Waves, Realized Price, Balanced Price, CVDD, and on-chain transfer volume.
Market Profit Structure
MVRV (Market Value to Realized Value) measures the degree of deviation of market price relative to the overall on-chain holding cost and is a core indicator for depicting the unrealized profit level of the entire market. Since the peak of this round, this indicator has significantly retreated. According to current data, as of March 22, 2026, BTC's MVRV has dropped to around 1.25, while this indicator once reached 2.29 near the price peak of this round, indicating that the unrealized profit level of the entire market has compressed by about 45% from its high, and the price premium relative to the holding cost is rapidly converging.
If observed over a longer cycle, the current level of 1.25 is at about the 23rd percentile of historical samples. If only considering data since 2018, it is roughly at the 18th percentile, indicating that the market has entered a relatively low-profit area in historical terms. However, compared to the final lows of previous typical bear markets, the current value has not yet reached extreme compression levels: the MVRV corresponding to the 2015 bear market low was about 0.54, about 0.70 in 2018, and about 0.76 in 2022. In other words, although the current MVRV has significantly retreated and entered a low-profit area in historical terms, there is still a certain gap compared to the extreme compression levels corresponding to the final lows of past bear markets.
From the cost mapping perspective, the current price of about $67,860 corresponds to an on-chain average holding cost (Realized Price) of about $54,363. This means that if the MVRV further drops to 1.0, the price would roughly correspond to around $54,000; if it compresses to the range of 0.8–0.9, the corresponding price would roughly fall in the range of $43,000–$49,000. Therefore, the current MVRV more accurately reflects that the market has not yet confirmed a "bottom," but rather that it has transitioned from a high-profit distribution phase to a significant profit contraction and is gradually returning to historical bottom valuation ranges. Combined with historical experience, this typically aligns more with the characteristics of the mid-to-late bear market or the early stages of bottom building, rather than the state of having completed the final bottom.
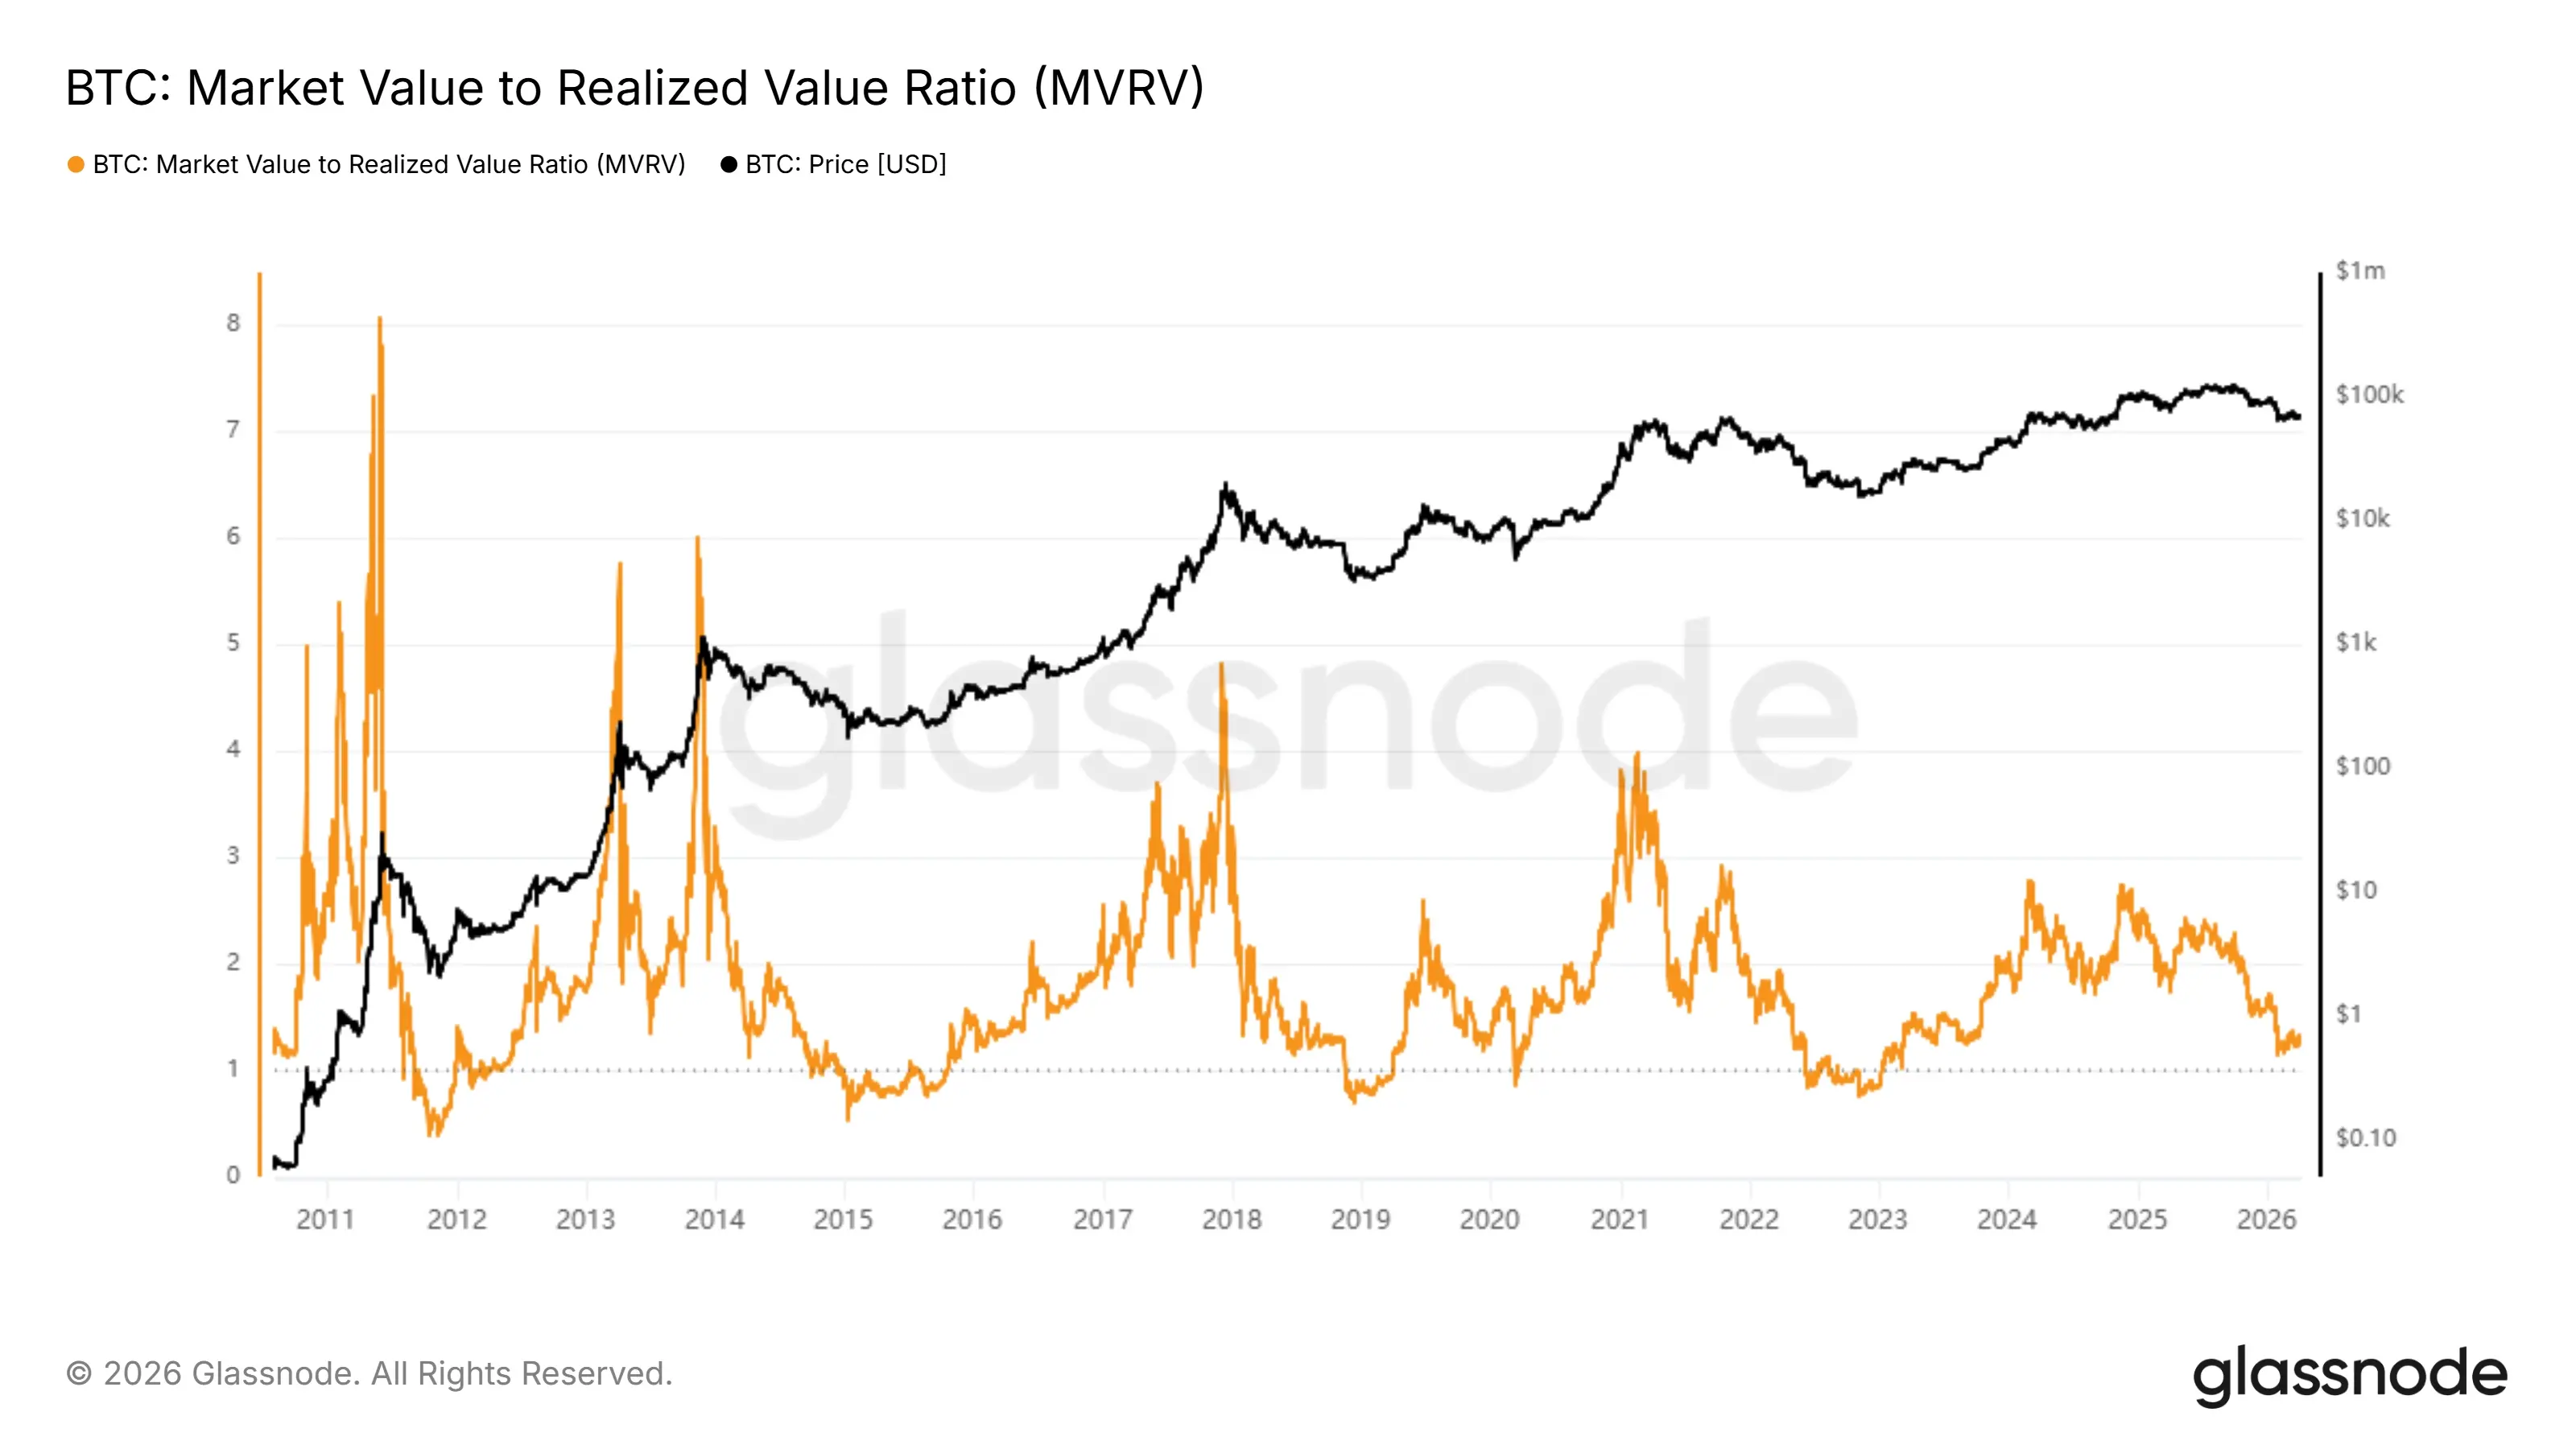
Figure 1. MVRV (from Glassnode)
In the context of the overall profit compression depicted by MVRV, a further key question to answer is whether the current market losses have been realized, that is, how is the clearing progress of high-cost chips. To this end, we can introduce the Entity-adjusted Realized Loss indicator to measure the scale of actual losses locked in by real investors in a loss state.
Corresponding to the unrealized profit compression, the on-chain actual loss realization has also significantly amplified. Entity-adjusted Realized Loss is used to measure the actual loss scale locked in by on-chain investors when transferring chips, which can more directly reflect whether the market clearing has transitioned from "paper losses" to "real selling pressure." According to current data, the peak of realized loss in this round occurred on February 7, 2026, reaching about $1.44 billion in a single day, representing a historical-level loss realization event; compared to the historical extreme peak of about $2.07 billion during the systemic deleveraging phase in June 2022, the intensity of this round's peak has reached about 70% of that. This indicates that this round of adjustment has not only remained at the valuation compression level but has already entered a clear chip clearing process.
However, from a dynamic perspective, the current realized loss has significantly retreated from the previous peak. As of March 22, 2026, this indicator is about $37.3 million per day, down about 74% from the peak in early February. This means that the previous concentrated stop-loss and passive selling phase may have already occurred, and the market is transitioning from intense release to high-level digestion. However, when viewed in the historical distribution, the current realized loss is still at about the 96th percentile of all history and about the 92nd percentile since 2018, indicating that although the loss realization has moved away from peak levels, it is still significantly above normal levels.
Additionally, from historical experience, the final formation of a bottom usually requires further observation of whether selling pressure shows signs of exhaustion, that is, after experiencing large-scale loss releases, even if the price continues to decline, realized loss no longer synchronously amplifies but instead shows marginal convergence or even divergence. This structure often indicates that high-cost chips have basically completed their clearing, and the market is gradually transitioning from a decline dominated by passive deleveraging to a self-stabilization after selling pressure diminishes. In terms of the current stage, realized loss more accurately reflects that the previous concentrated selling pressure has significantly eased, but the clearing process of loss chips has not yet ended. Combined with the MVRV, which has significantly retreated but is still above the final low range of previous bear markets, the current market more closely aligns with the characteristics of the mid-to-late bear market or the bottom-building stage: clearing has begun, but the final confirmation of the bottom still needs to wait for further convergence of loss realization and stabilization of price structure to occur together.
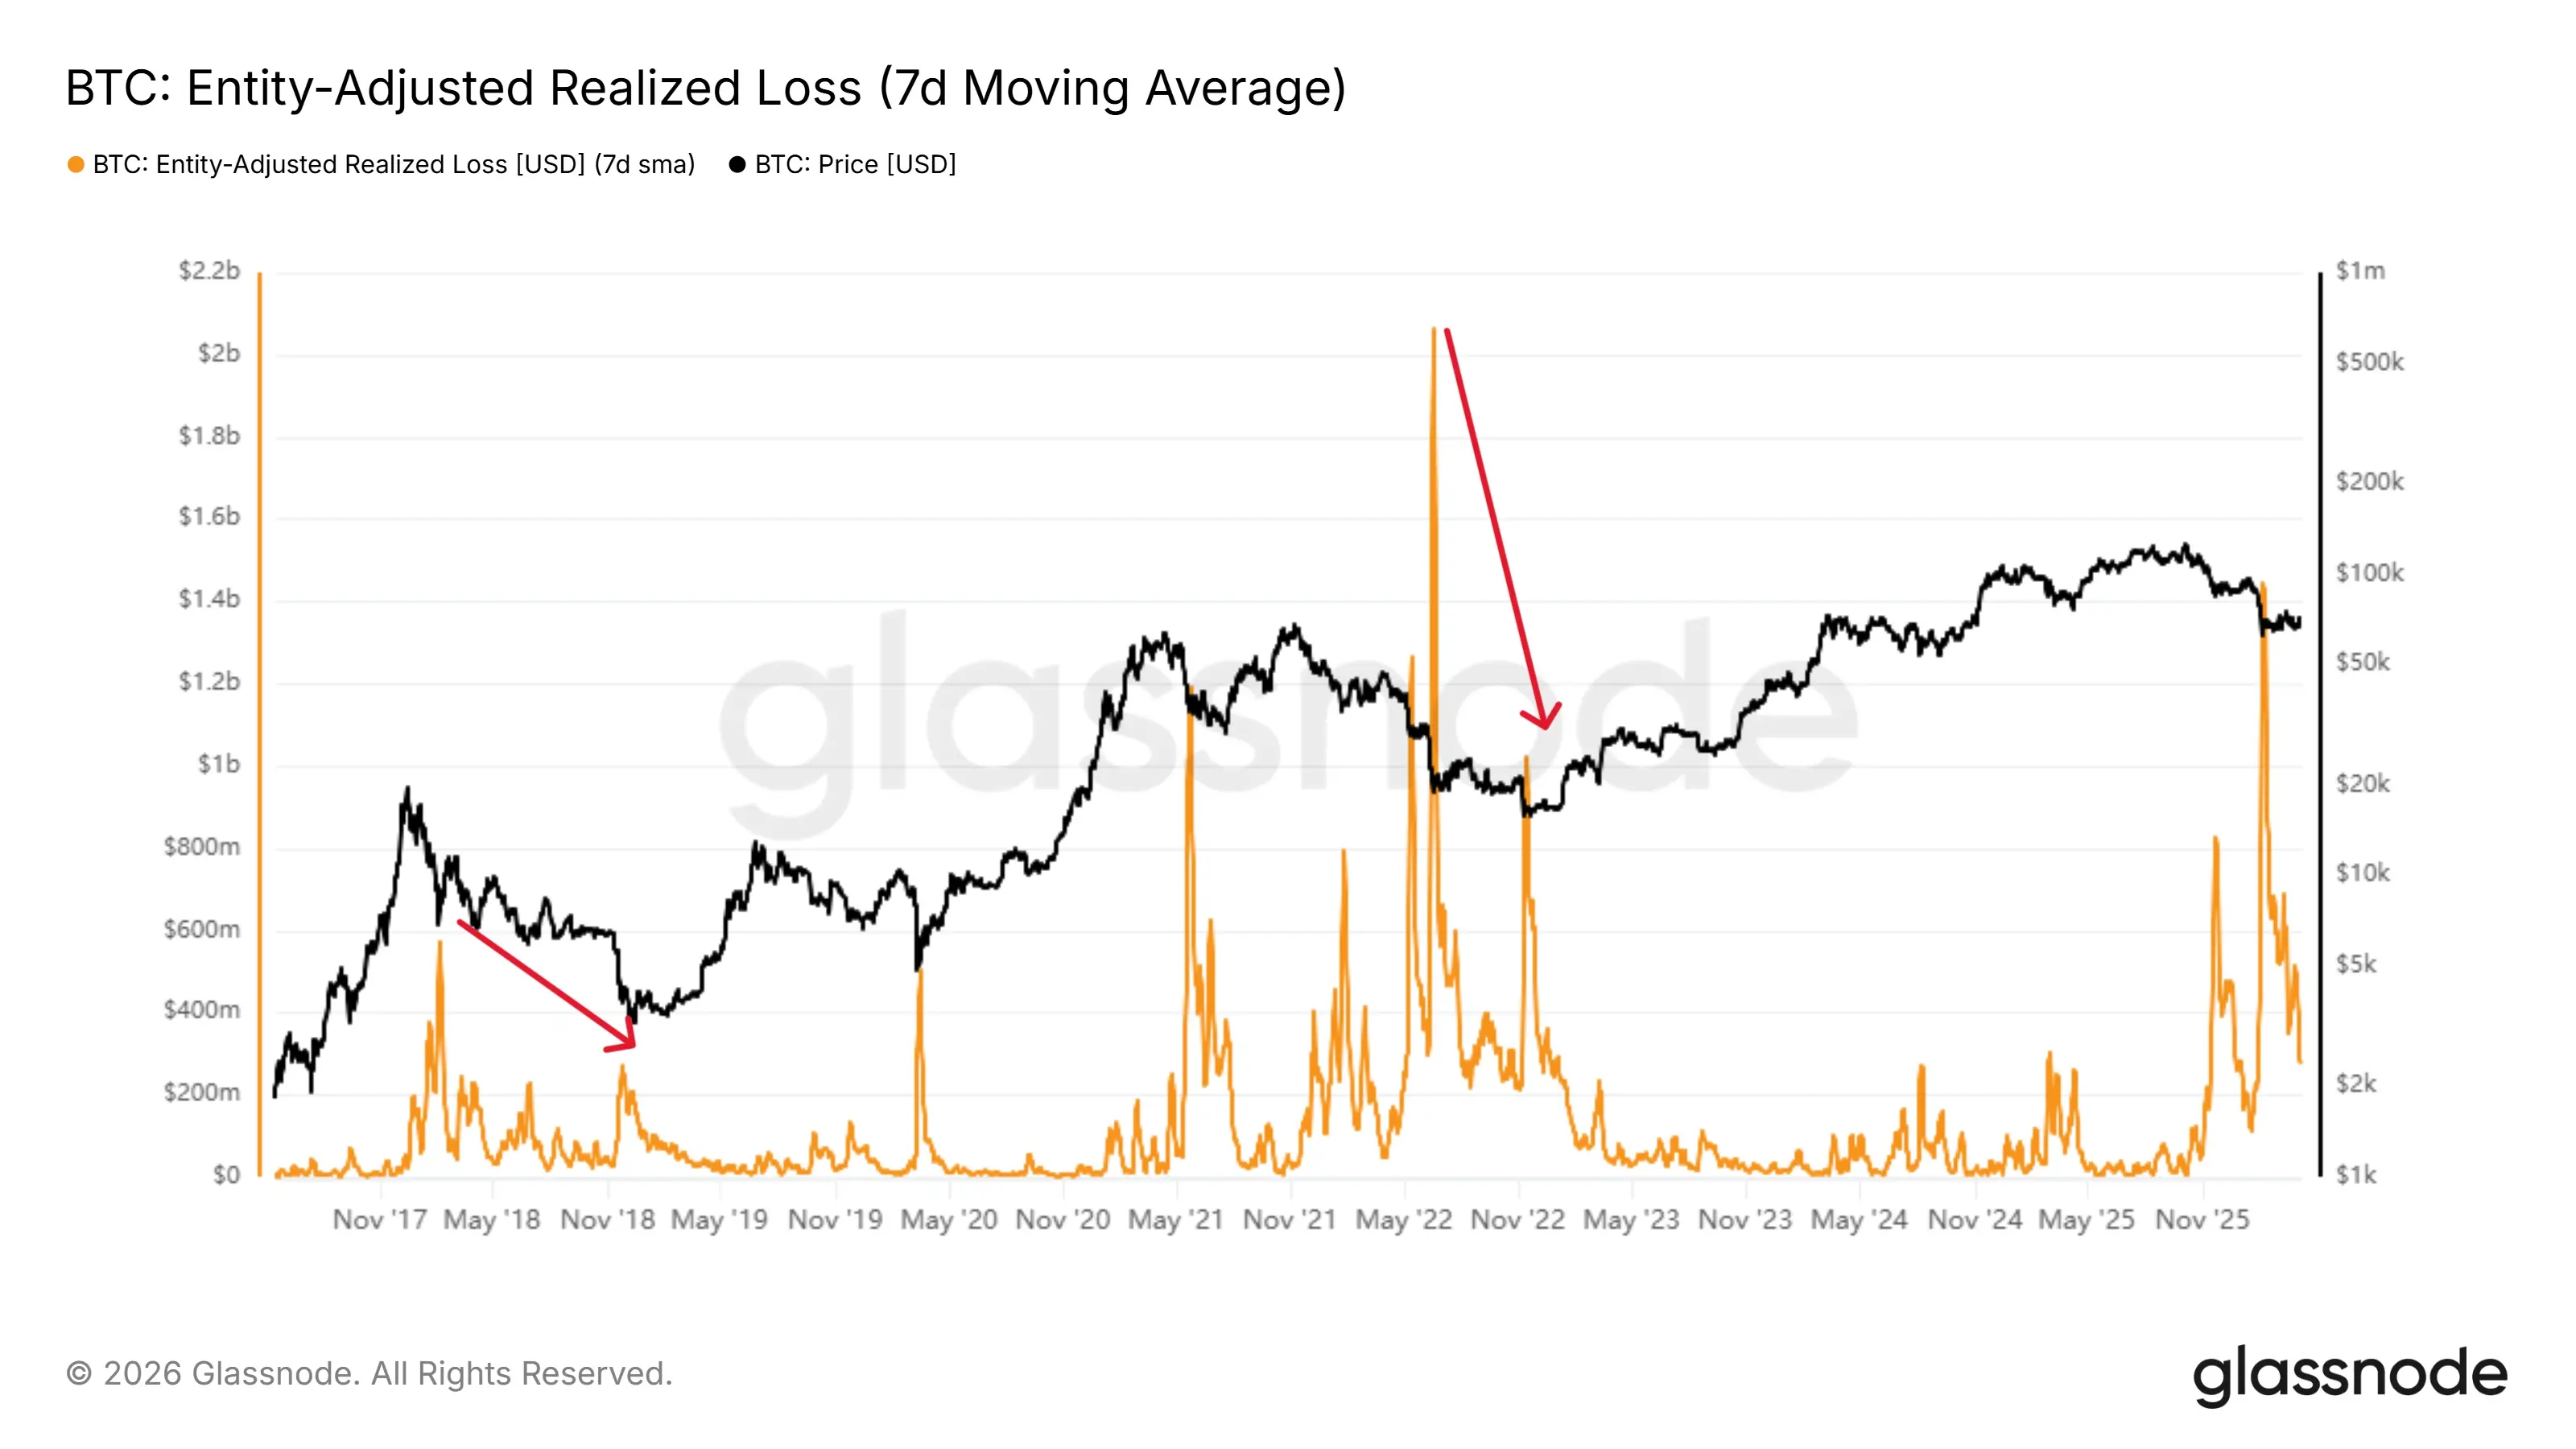
Figure 2. Entity-Adjusted Realized Loss (from Glassnode)
Overall, the profit compression reflected by MVRV, along with the high-intensity loss realization shown by Realized Loss, indicates that the market is no longer in the stage of paper losses but has entered the process of actual loss release and passive clearing of high-cost chips. This means that the pressure of this round of decline has further transmitted from valuation retreat to the holding structure itself, and the market is completing the transition from "profit contraction" to "loss digestion." Therefore, the next key observation focus is no longer whether losses occur, but whether selling pressure can further exhaust and promote chips to settle into more stable holders.
Holder Behavior
After confirming that the market has entered the actual clearing and cost reset phase, the further question to answer is: who currently dominates the pricing power in the market, and whether the cleared chips have completed effective settlement. To this end, we can combine Entity-Adjusted SOPR and Realized Cap HODL Waves to characterize the market from both behavioral and structural dimensions.
From the trading behavior perspective, Entity-Adjusted SOPR has recently continued to operate below 1, and after smoothing, it shows a gradually downward trend, indicating that the trades occurring in the current market are still primarily driven by loss selling. This means that although there has been large-scale loss realization in the early stage, the market has not yet completely escaped the state dominated by passive stop-loss, and marginal selling pressure is still driven by short-term funds, with pricing power not yet transferred to more patient holders.
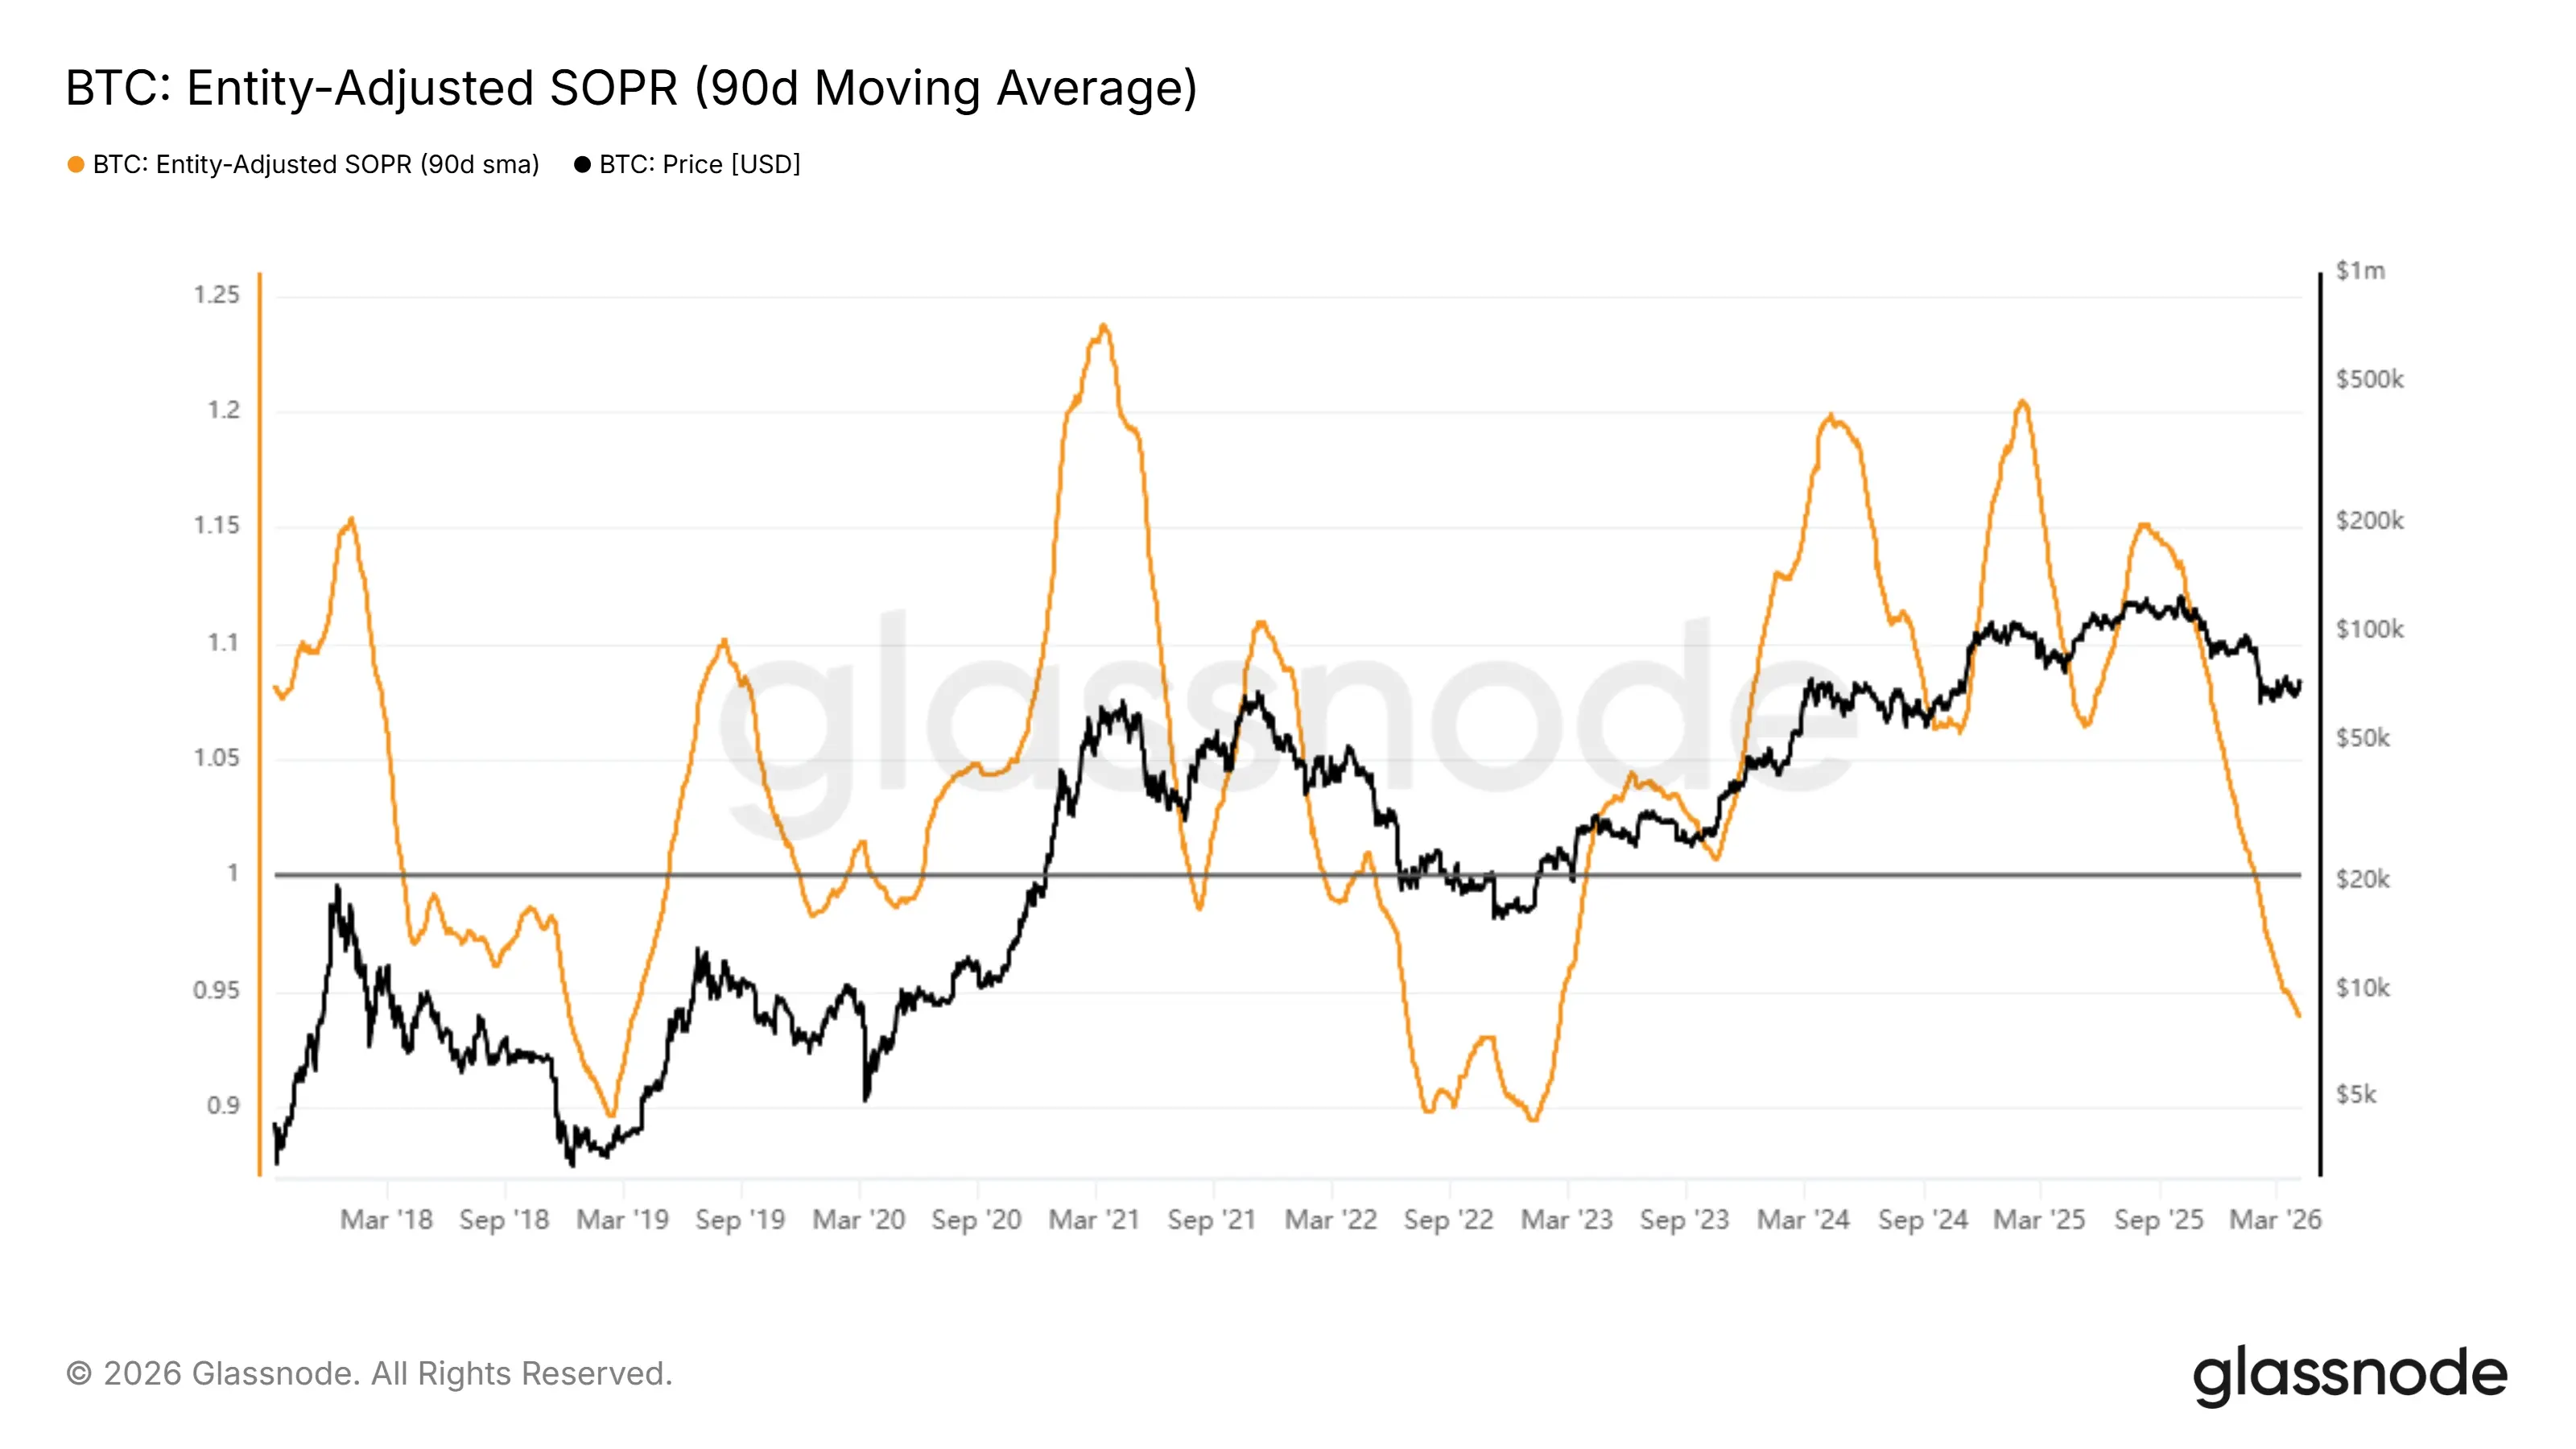
Figure 3. Entity-Adjusted SOPR (from Glassnode)
From the chip structure perspective, the Realized Cap-weighted HODL Waves show that the proportion of short-term chips (1w–3m) remains relatively high, while the proportion of chips in the 1y–2y range continues to rise. This structure indicates that investors who entered at high levels in the previous cycle are gradually transforming from short-term holders to medium- to long-term holders, and the market has undergone a significant redistribution process. However, compared to the historical bear market bottoms, the proportion of long-term chips (1y+) has not yet shown extreme elevation, and the degree of chip locking is still insufficient, indicating that the market structure is still in the "settling process" rather than a fully stable state.
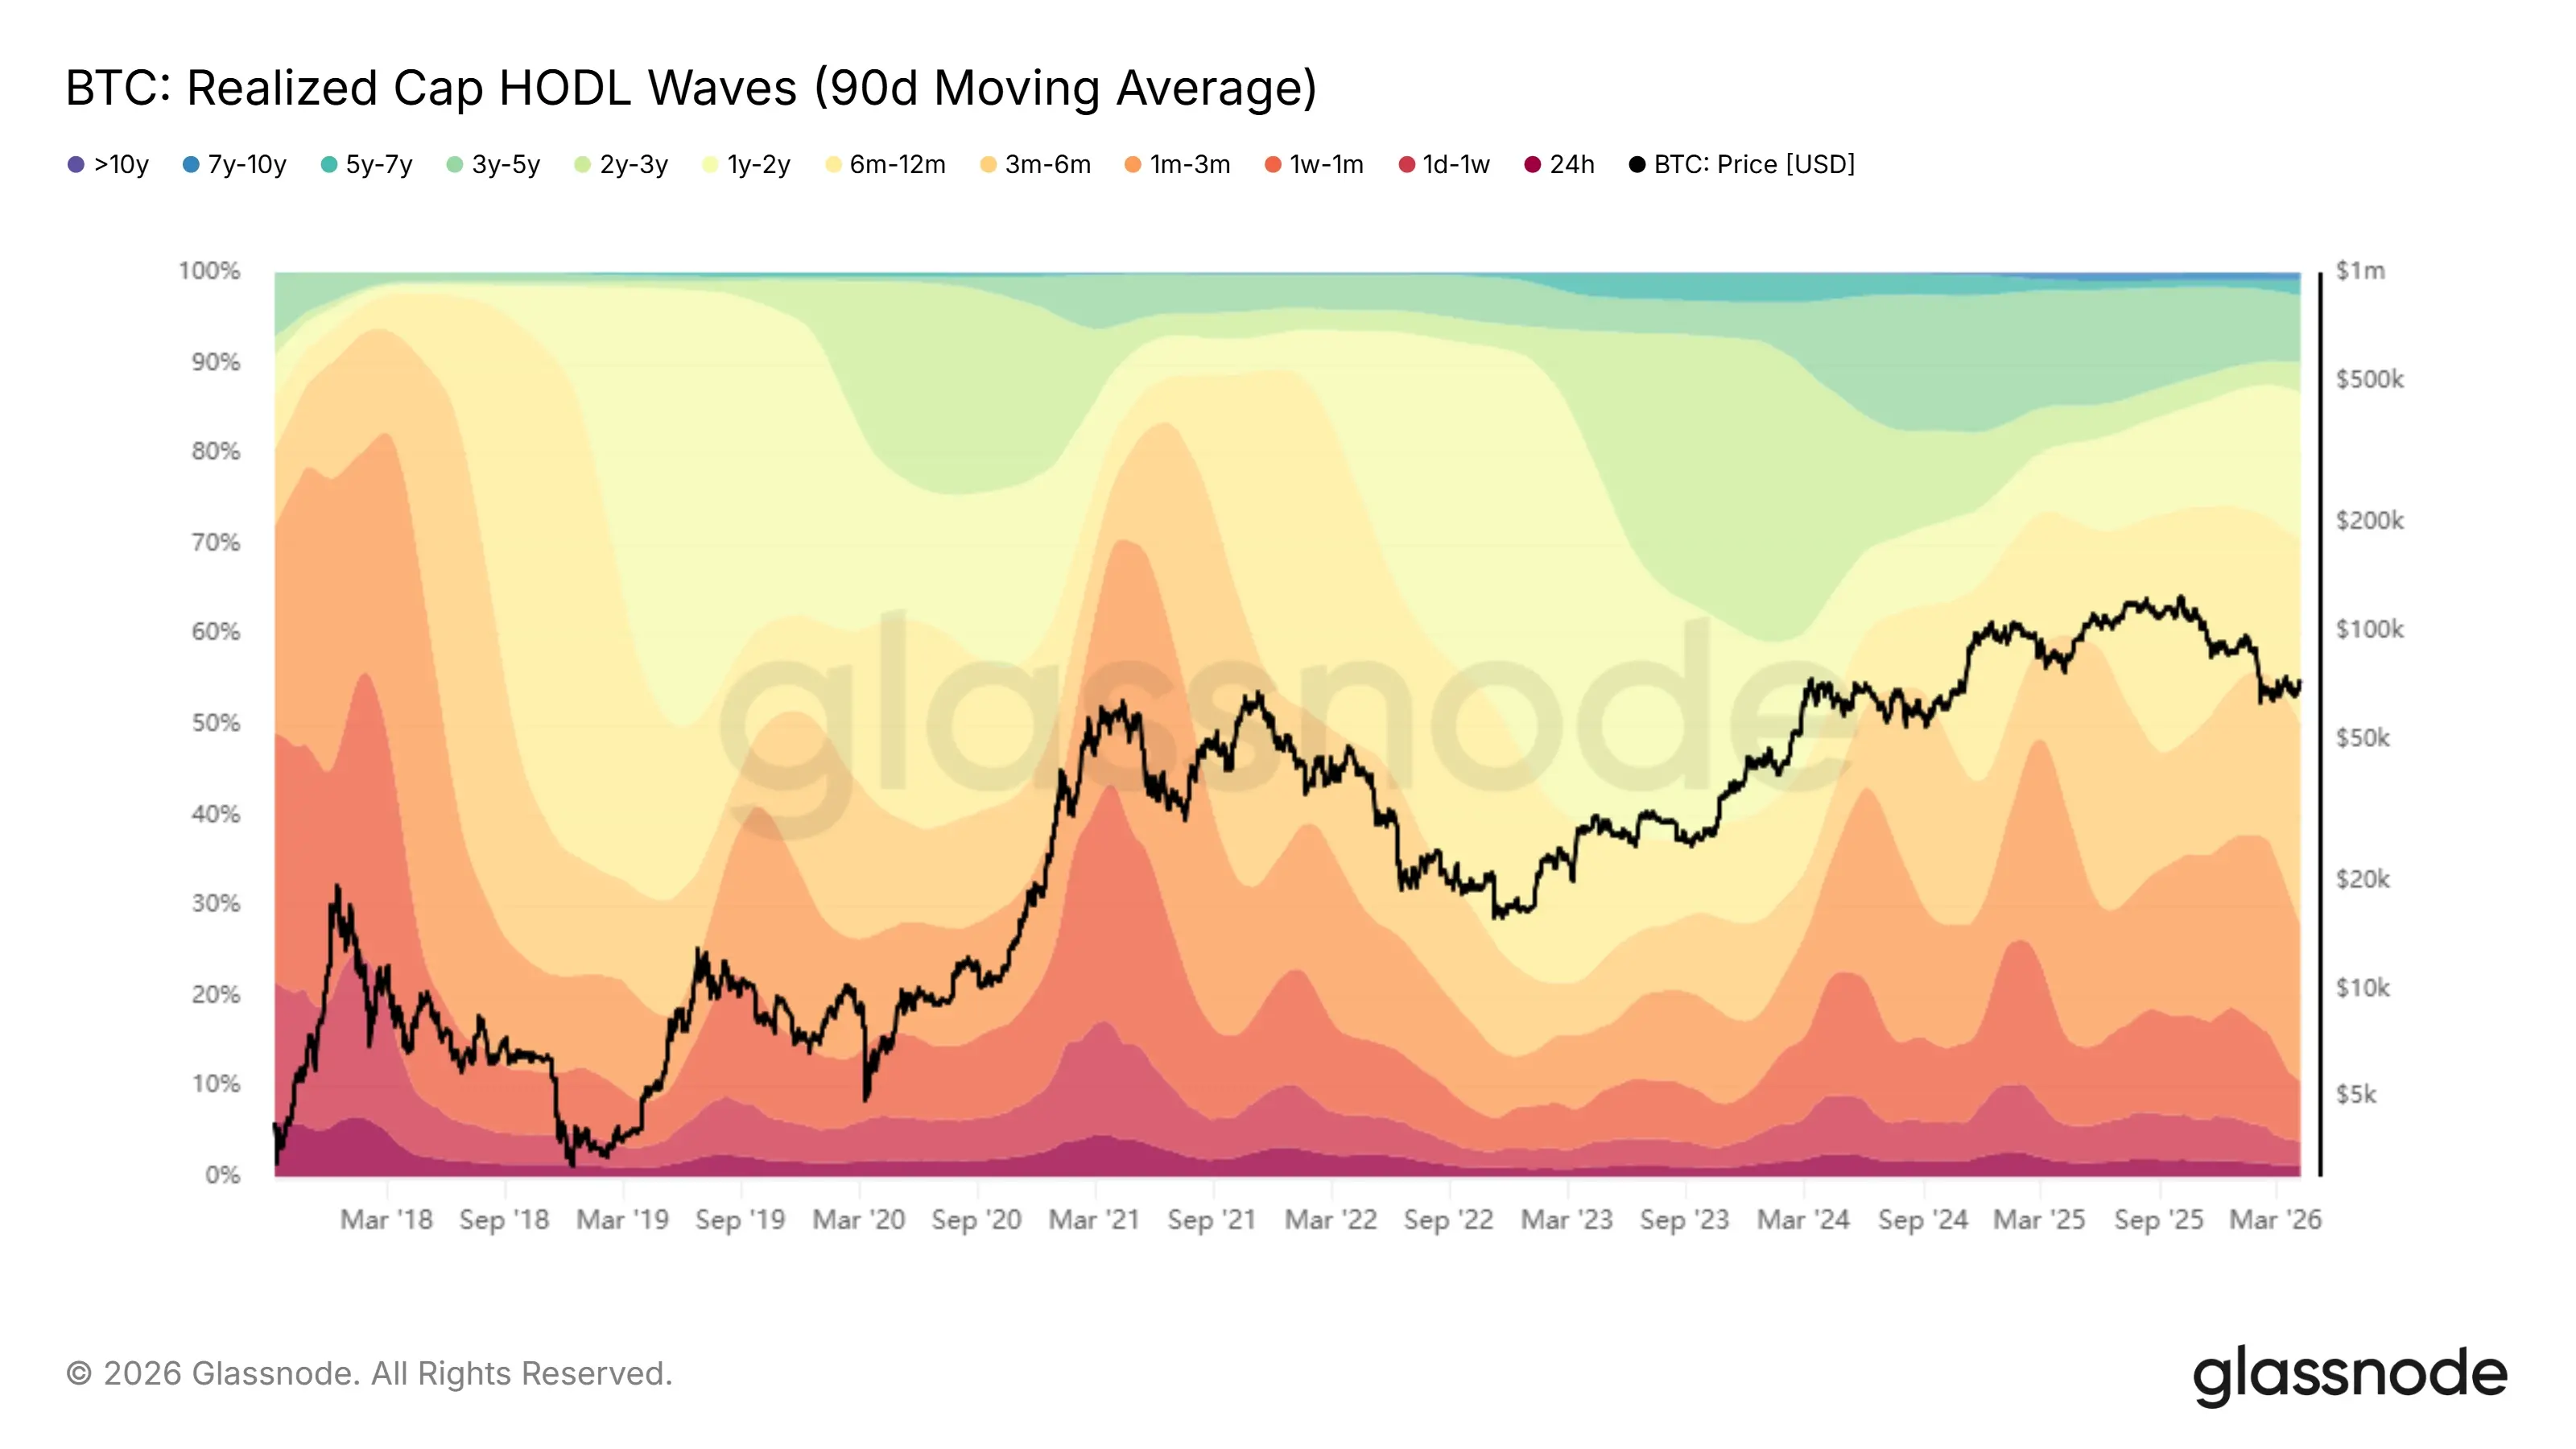
Figure 4. Realized Cap HODL Waves (from Glassnode)
In summary, looking at the changes in SOPR and Realized Cap HODL Waves, the market has indeed entered the chip redistribution phase, and the current more accurate state is: passive selling by short-term funds is still affecting marginal pricing, while medium- to long-term holders, although gradually absorbing chips, have not yet formed a sufficiently solid dominant position. In other words, the market is transitioning from "passive clearing dominated by short-term funds" to "chip settlement dominated by long-term funds," but the switch in pricing power has not yet been fully completed.
Market Cost Reset
After confirming that the market has entered the clearing promotion phase from the perspectives of profit structure, loss realization, and chip redistribution, the further core question to answer is: what is the current price relative to the overall market cost and long-term value anchors, and whether pricing has completed a sufficient reset. To this end, we can introduce Realized Price, Balanced Price, and CVDD as three indicators to characterize the market from both cost and value perspectives.
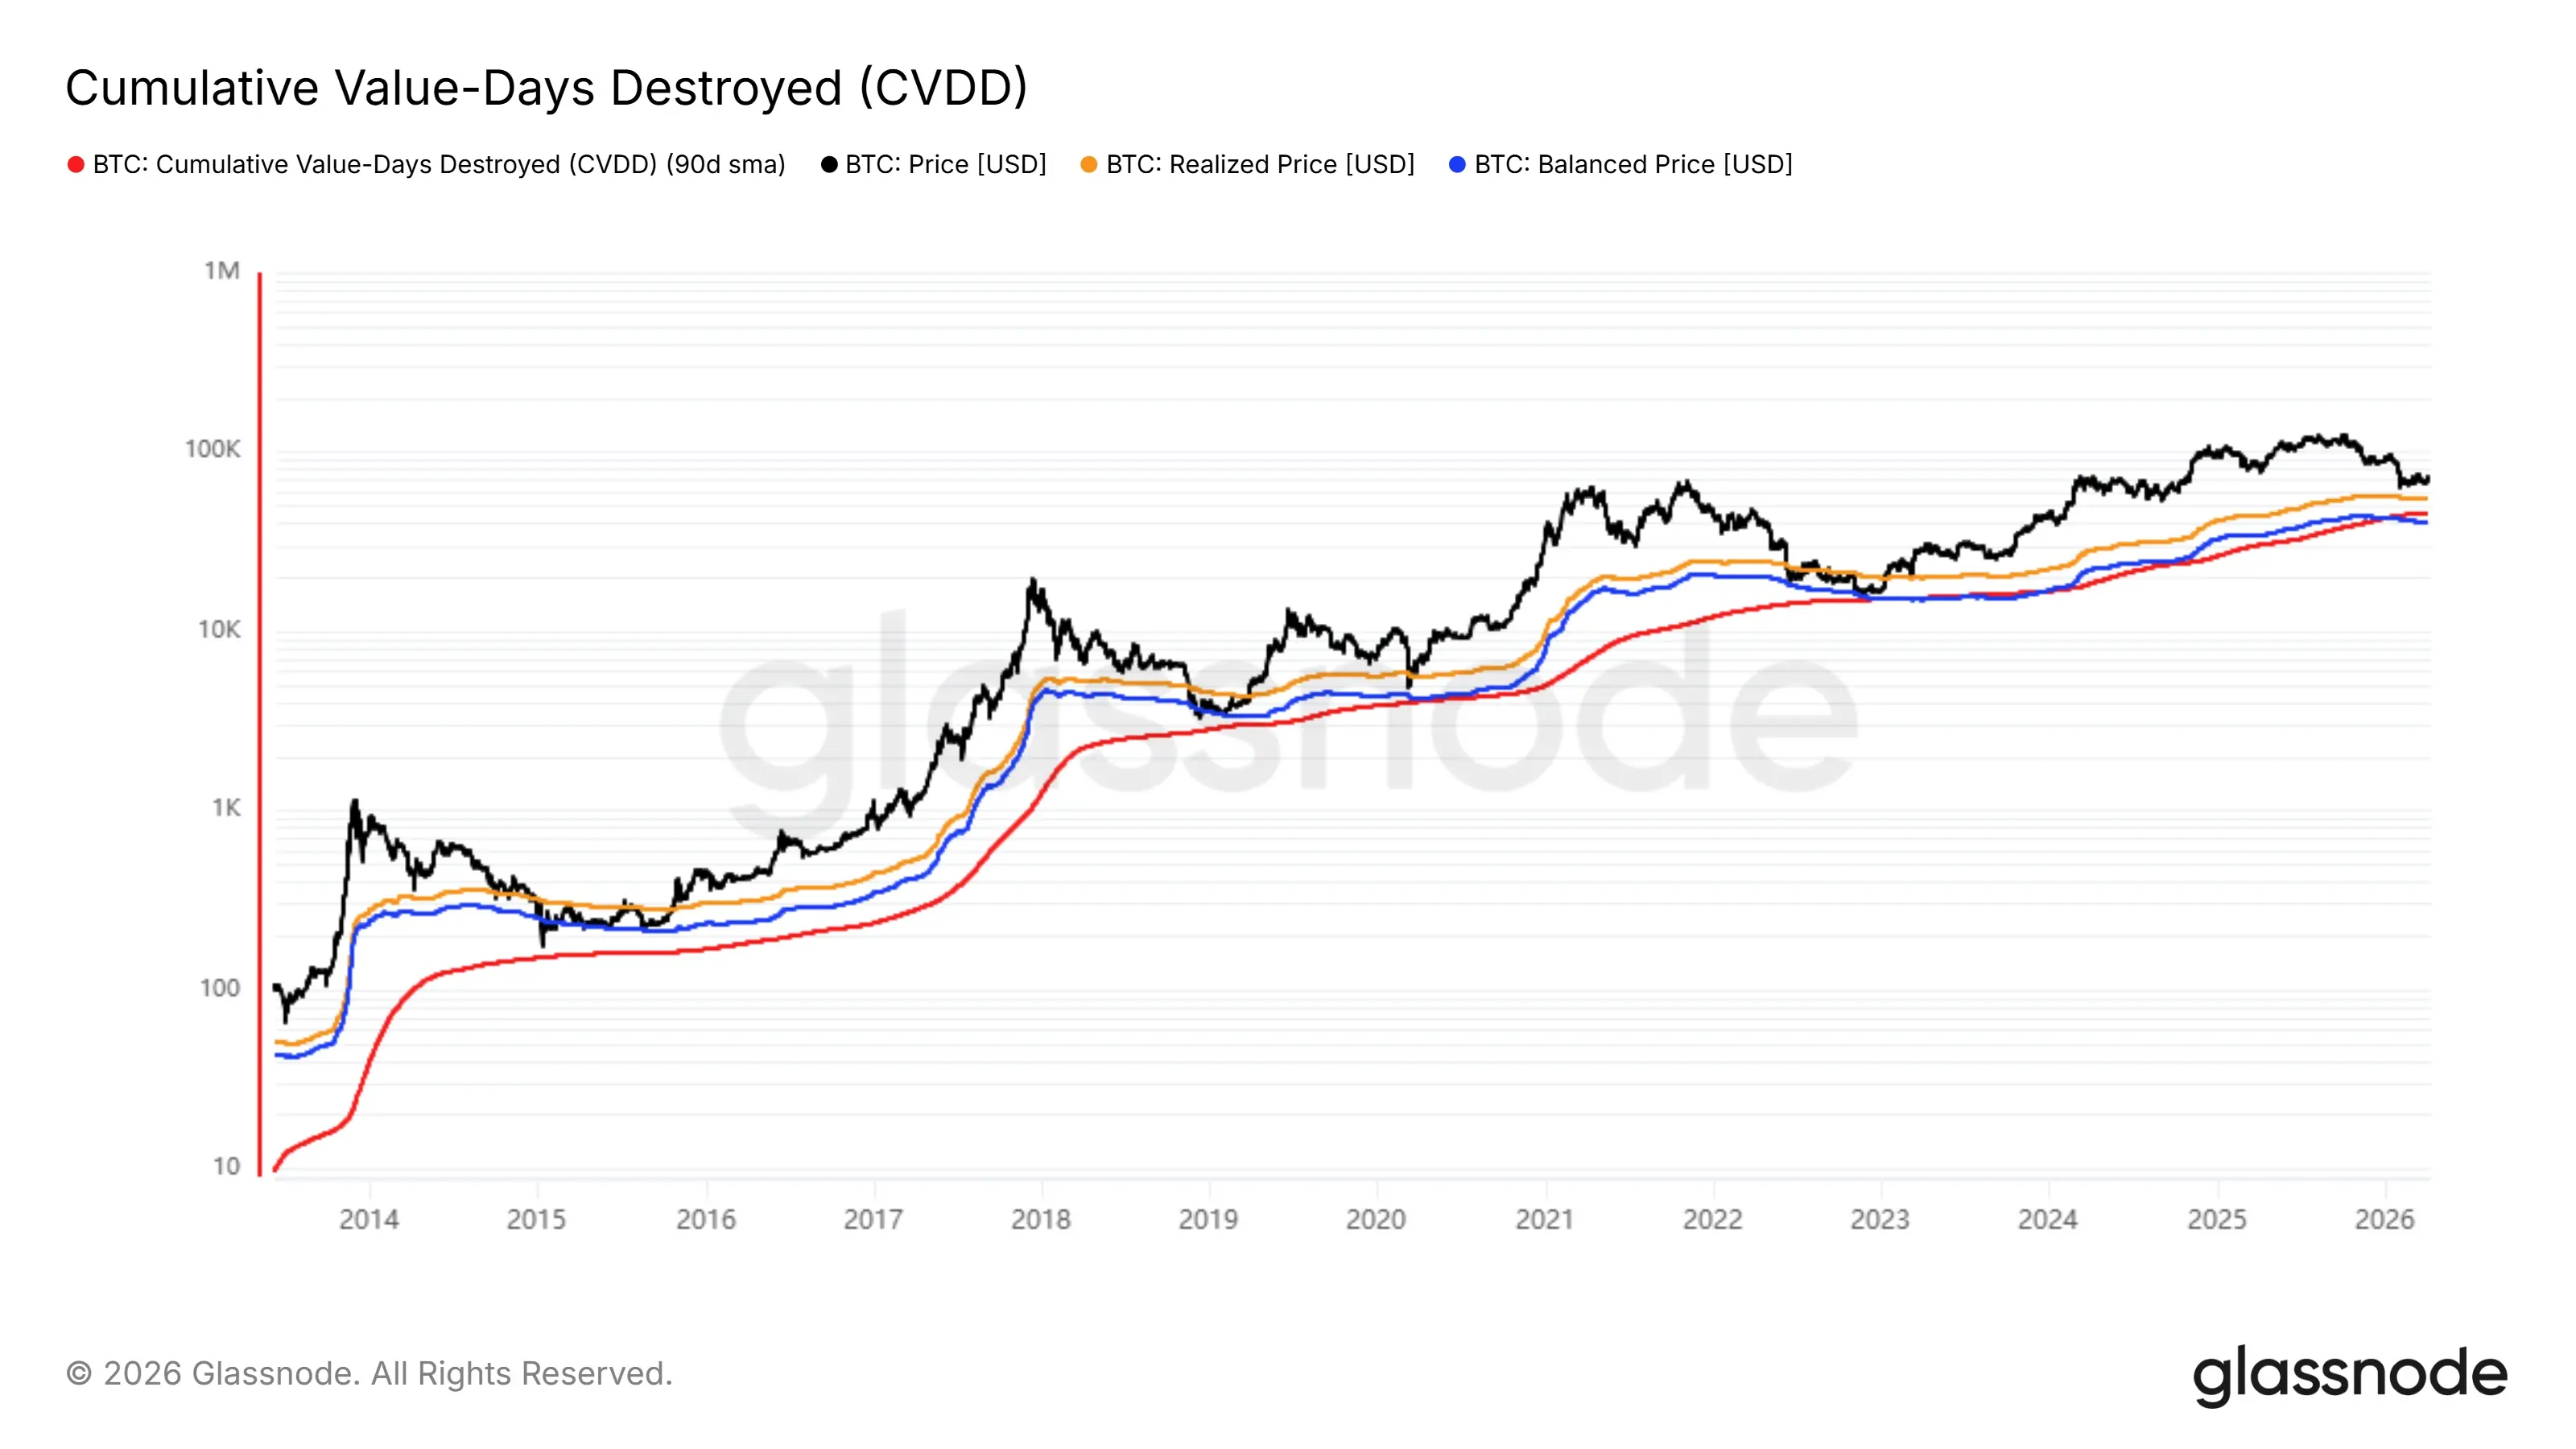
Figure 5. Realized Price, Balanced Price, CVDD (from Glassnode)
First, Realized Price, as the average holding cost of the entire market, is the most direct cost anchor. Historically, prices often fall below this level in the mid-to-late bear market, entering a broad loss area; in the late bear market, prices typically oscillate around it, reflecting the market's transition from "sustained losses" to "cost reset." As of March 22, 2026, the BTC price is about $67,860, while the Realized Price is about $54,363, meaning the current price is still about $13,500 above this cost line, corresponding to a premium of about 24.8%. This indicates that although the market has significantly retreated from its high, the overall profit space has been compressed, but the price has not yet truly returned to the average holding cost of the entire market, and the cost reset process has not been completed.
Second, CVDD provides a value anchoring range from a more long-term fund perspective by depicting the changes in coin age value accumulated by long-term holders. Historically, prices have significantly returned to levels corresponding to CVDD during multiple cycle bottom phases, reflecting that when long-term chips are fully transferred, the market enters a region with more medium- to long-term allocation value. The current CVDD is about $45,420, while the current price is still about $22,440 above this level, corresponding to a premium of about 49.4%. This indicates that although the price has significantly moved down from previous highs, from the perspective of long-term fund value anchors, the current market is still operating above this range and has not completed a full return to the long-term value area.
Furthermore, Balanced Price can be seen as the equilibrium price corresponding to the market after experiencing emotional clearing and holding reassessment. In deep bear market phases, prices often converge towards this level, even briefly falling below it, to complete the final round of emotional and leverage clearing. As of now, the Balanced Price is about $40,726, and the current price is still about $27,134 above it, corresponding to a premium of about 66.6%. Compared to Realized Price and CVDD, Balanced Price better reflects the equilibrium area under deep clearing conditions, and the current price still has a significant distance from it, indicating that although the market has significantly retreated from an overvalued state, it is still not close to a truly deep equilibrium area.
If we further compare with historical bottom phases, we can see the current position more clearly. At the 2015 bear market low, the price was about 0.55 times Realized Price, 0.71 times Balanced Price, and 1.11 times CVDD; at the 2018 bear market low, these ratios were about 0.70 times, 0.89 times, and 1.10 times, respectively; at the 2022 bear market low, the price was about 0.78 times Realized Price, 1.01 times Balanced Price, and 1.05 times CVDD. In contrast, the current price is still about 1.25 times Realized Price, 1.67 times Balanced Price, and 1.49 times CVDD. This indicates that although the current market has significantly retreated from a high premium state and is beginning to converge towards cost and value anchors, the price is still significantly above these key anchor points compared to the final lows of previous typical bear markets.
In summary, the cost and value ranges depicted by Realized Price, CVDD, and Balanced Price indicate that the current market is closer to "returning to the value range" rather than "having completed equilibrium within the value range." In other words, the focus of the pricing system is indeed shifting downward, and the market has entered a stage of re-pricing around long-term costs and value anchors, but from a quantitative position perspective, the price has not yet completed a full return to average costs, long-term value support, and deep equilibrium areas. True bottom confirmation often still requires seeing the price further compress towards these anchor points and forming a more stable operating structure nearby.
On-Chain Activity
Further attention needs to be paid to whether the turnover intensity reflected by real on-chain trading activities has entered the final clearing phase. To this end, we can introduce the Entity-Adjusted Transfer Volume to measure the scale of real value transfer in the market.
From historical experience, this indicator shows relatively clear phase characteristics in cycles: in the mid-to-late bear market, as prices continue to decline and participants exit, on-chain transfer volume typically gradually decreases, reflecting a contraction in market activity and a weakening of funding participation willingness. In the late bear market, especially close to the bottom area, there are often one or several significant phase volume spikes, representing a large number of chips being transferred in a short time. Such "concentrated turnover" usually corresponds to panic selling, passive deleveraging, and redistribution between long-term holders and new funds, marking an important sign that the market has completed its final clearing.
Observing the current cycle, although the on-chain transfer volume is overall at a relatively low historical level, indicating that the market has experienced significant cooling, there has not yet been a noticeable volume spike characteristic corresponding to historical bottom phases. This means that although the aforementioned loss realization and chip redistribution have occurred, the on-chain value transfer has not yet experienced the "final round of concentrated release." In other words, the current market is closer to the mid-to-late stage after clearing rather than the bottom stage where final turnover has been completed.
The key revealed by the current on-chain activity is not whether the market has cooled down, but that the final meaningful chip turnover has not yet occurred. Although loss realization, chip redistribution, and cost return have all begun, the on-chain value transfer has not shown the typical concentrated volume characteristics of historical bottom phases, indicating that the market has not completed the final round of large-scale chip turnover driven by panic release, funding support, and holding reconstruction. If this signal appears subsequently, it is more likely to indicate that the bottom building is transitioning from "process advancement" to "phase completion."
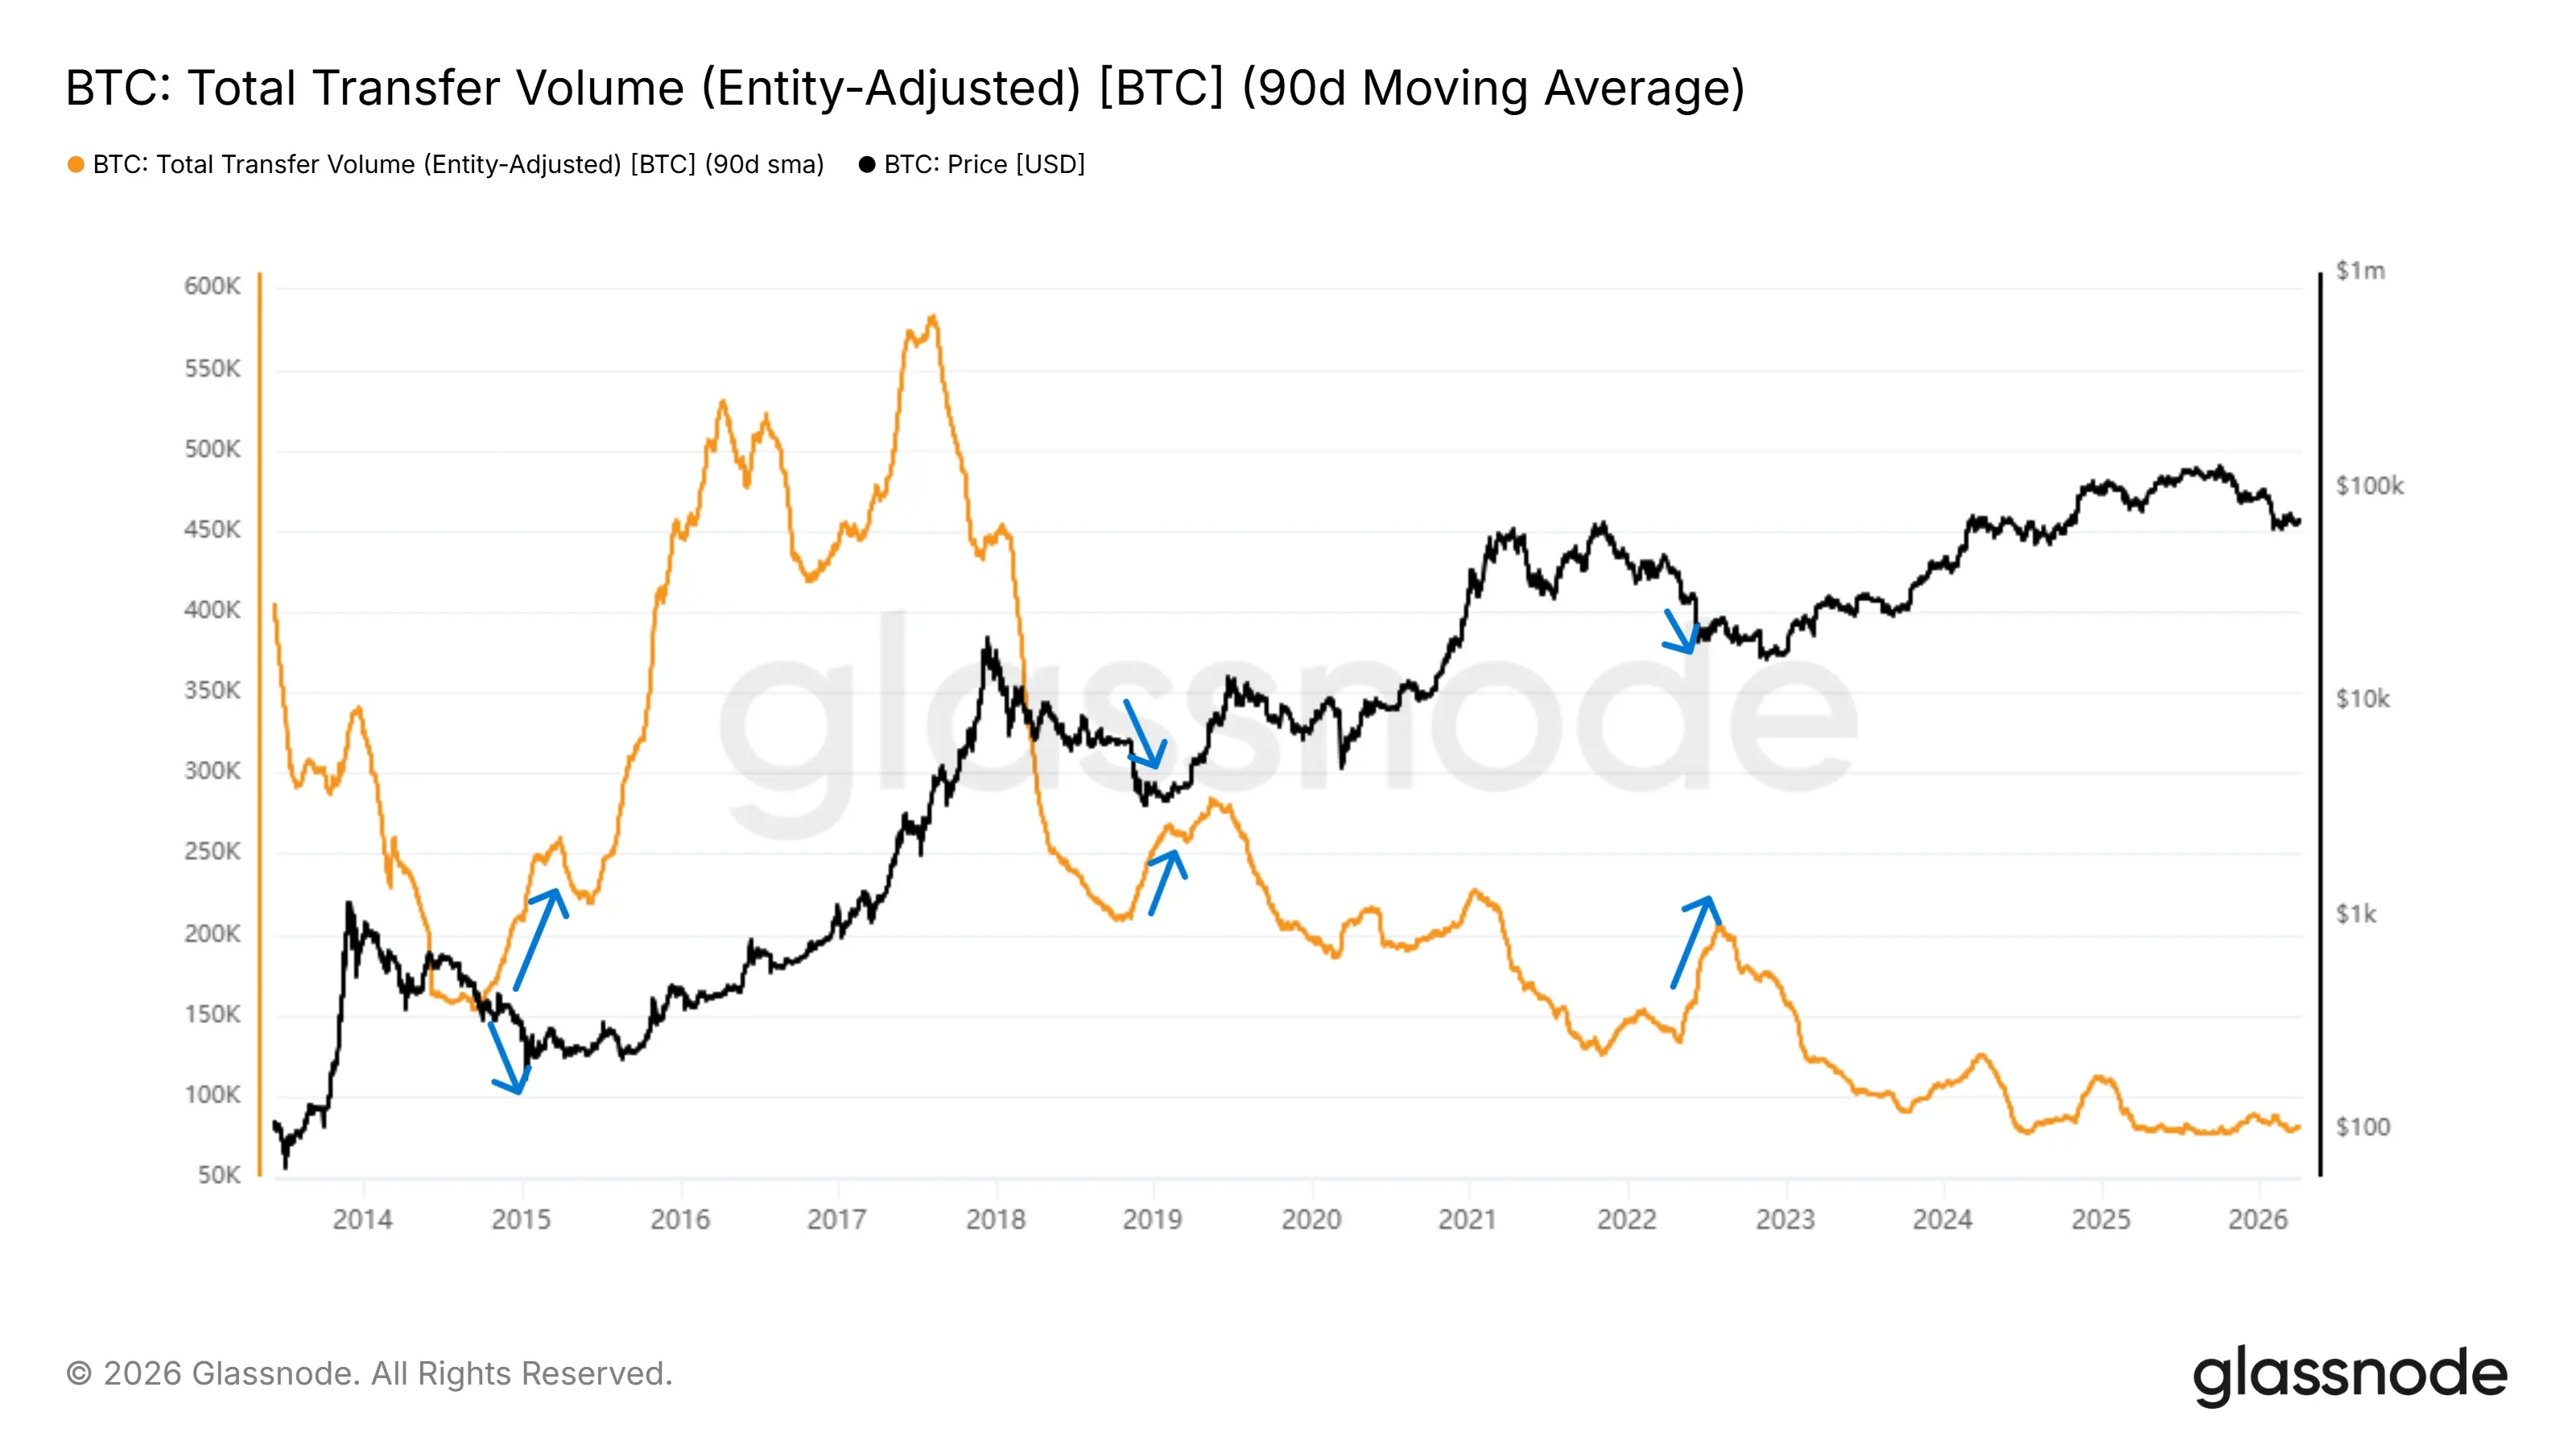
Figure 6. Total Transfer Volume (Entity-Adjusted)
Conclusion: Cycle Position Judgment, Price Range, and Potential Evolution Path
Based on the analysis from multiple dimensions such as profit structure, loss realization, holder behavior, cost structure, and on-chain turnover intensity, a relatively consistent judgment can be formed regarding the current market's cycle position. First, from the combination of MVRV and realized loss, the market has transitioned from a purely paper loss phase to the actual loss realization and deleveraging process, with high-cost chips having been sufficiently cleared in this round of decline. Second, from the behavioral and structural characteristics reflected by SOPR and Realized Cap HODL Waves, although significant chip redistribution has occurred, short-term funds still somewhat dominate trading, and the dominant position of long-term holders has not yet been fully established, indicating that the market structure is still transitioning from "liquidity" to "settlement."
Furthermore, from the perspective of cost structure, the current price has significantly converged towards the value ranges depicted by Realized Price, Balanced Price, and CVDD, indicating that the market is gradually completing the return process from an overvalued state to cost and value anchors. However, the current price still operates significantly above the aforementioned cost and value ranges, indicating that the pricing reset process is still ongoing, and the market has not entered the final equilibrium stage. Meanwhile, although the on-chain transfer volume is at a low level, it has not shown the typical concentrated volume characteristics of historical bottom phases, meaning that the market has not yet experienced the final round of large-scale chip turnover.
In this framework, the current market more closely aligns with the typical characteristics of the mid-to-late bear market, where clearing has significantly advanced, costs are gradually resetting, and chips are transitioning from redistribution to locking, but the bottom has not yet been finally confirmed. Based on the historical performance of cost ranges, if the price further declines, its potential bottom range may be located between $45,000 and $53,000, which may correspond to the position where long-term funds begin to systematically support. From historical cycle experience, market bottoms are often not a single price point but involve a period of repeated oscillation within that value range to complete emotional clearing, supply-demand rebalancing, and final chip locking.
In terms of time dimension, past cycles show that from large-scale loss realization to the final bottom formation, it usually still requires several months (4 to 7 months) of oscillation and structural adjustment process. Therefore, at the current stage, the market is more likely in the early stage of bottom building, with expectations that the market may complete the bottom building this summer. Future signals to focus on include: marginal exhaustion of realized loss, stable return of SOPR near 1, further elevation of long-term chip proportion, and phase amplification of on-chain turnover intensity. Once the above signals gradually resonate, the market is more likely to enter a new upward phase driven by supply contraction and value reassessment.
Related Projects

Latest News
ChainCatcher
Apr 12, 2026 02:36:53
ChainCatcher
Apr 11, 2026 23:56:47
ChainCatcher
Apr 11, 2026 23:28:20
ChainCatcher
Apr 11, 2026 23:01:55
ChainCatcher
Apr 11, 2026 22:22:42