
The daily chart shows a large lower shadow, unable to reach a new high for 16 consecutive days: where is the true bottom for BTC?
Author: Luckshury, full-time trader, currently building Entropia Trading
Compiled by: Gu Yu, ChainCatcher
I want to share this content because it is an article I previously had in draft, discussing how I look for various bottoming patterns in the market, including common patterns I observe, signals I hope to see, and signals I do not want to see. My experience comes from nearly 8 years of trading BTC and using it as a source of full-time income.
The Past 45 Days
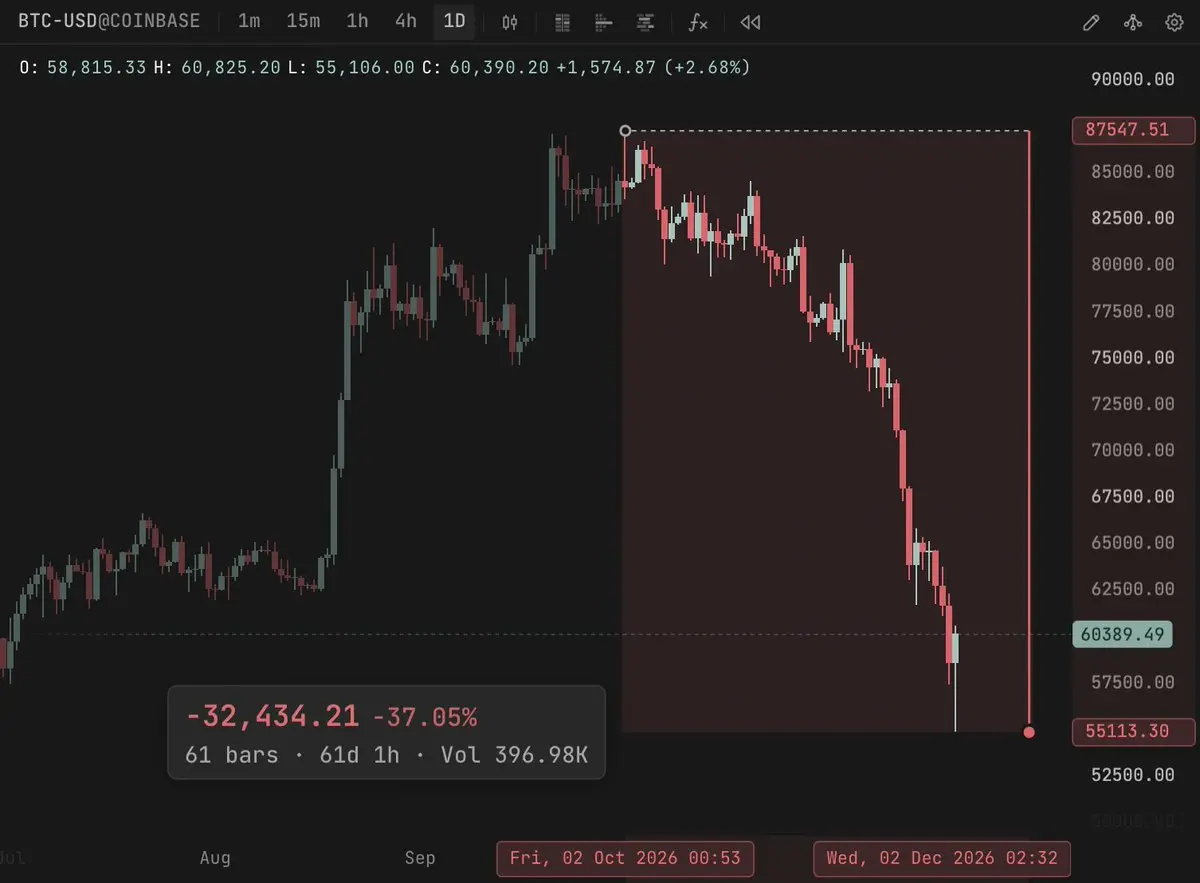
BTC traded around 80k-87k at the beginning of October and has now fallen below 56k, down over 50% from the 126k peak.
When judging the timing of a low, I do not pay much attention to macro news headlines; I mainly focus on price action (PA) and order flow.
What I Do Not Want to See
Huge wicks on the 1d/4h/30m charts, in my opinion, indicate inefficient price action, and I believe these wicks will be filled. Based on this premise, I ultimately expect the price to move lower, at least partially or fully filling the wicks. This does not mean that a "low" cannot have already occurred; it just means that a larger range is likely to form afterward, providing better entry opportunities.
I also find that huge wicks provide opportunities to short subsequent rebounds in such cases, with the target being at least a partial fill of the huge wick.
I do not explicitly define what constitutes a "huge wick," as it varies with market conditions; in my system, this is one of the more subjective parts. I want to emphasize that this mainly comes from trading the same asset for 8 consecutive years and continuously studying similar patterns on the charts.
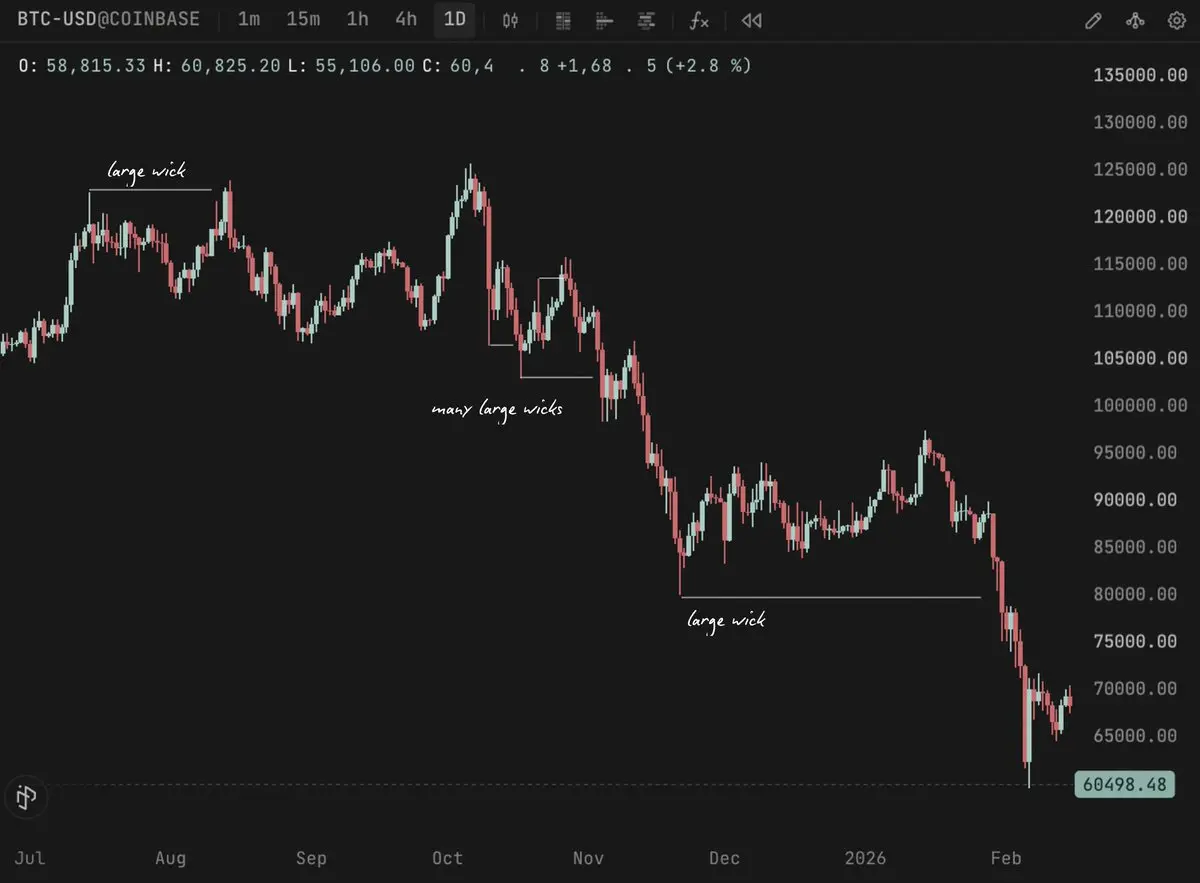
The movement into the initial bottom should not be a "slow grind," mainly because this does not provide a clear inefficient movement upward after the bottoming pattern forms. It does not create the path of least resistance.
What I Hope to See
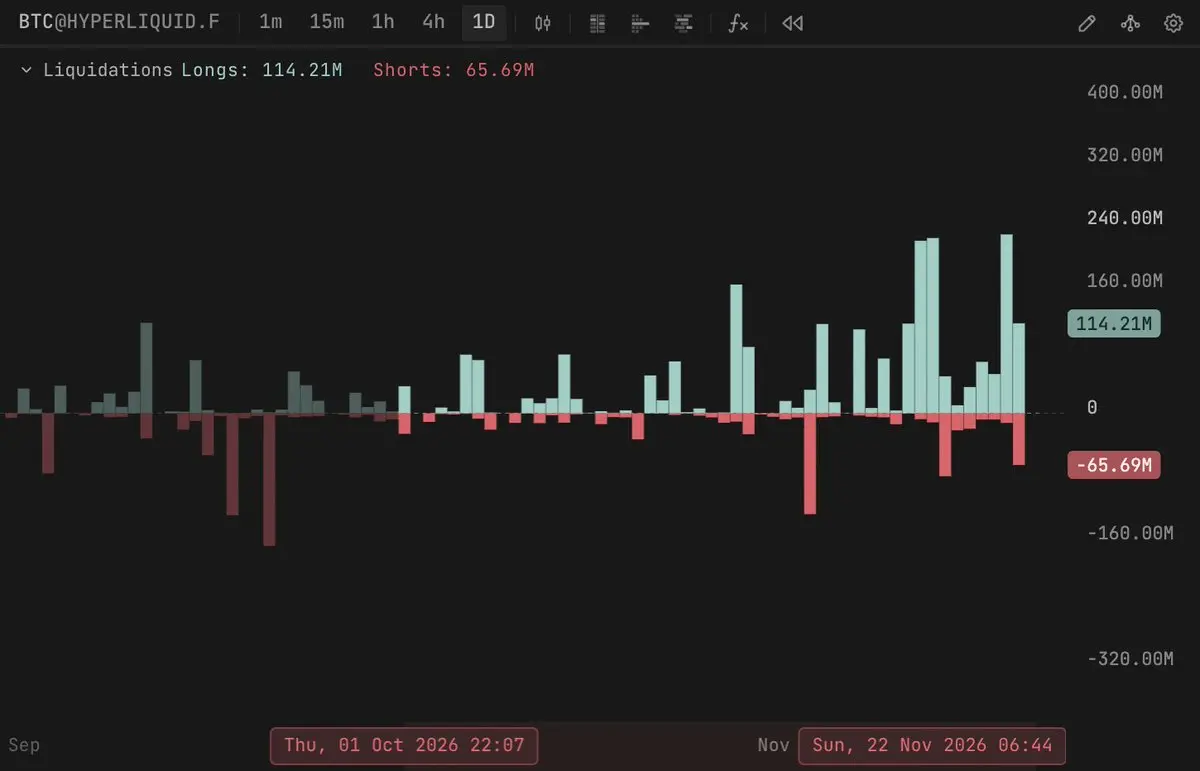
The initial decline driven by a large number of liquidations, with rapid drops creating inefficient price action during the decline, often also includes significant washouts of open contracts.
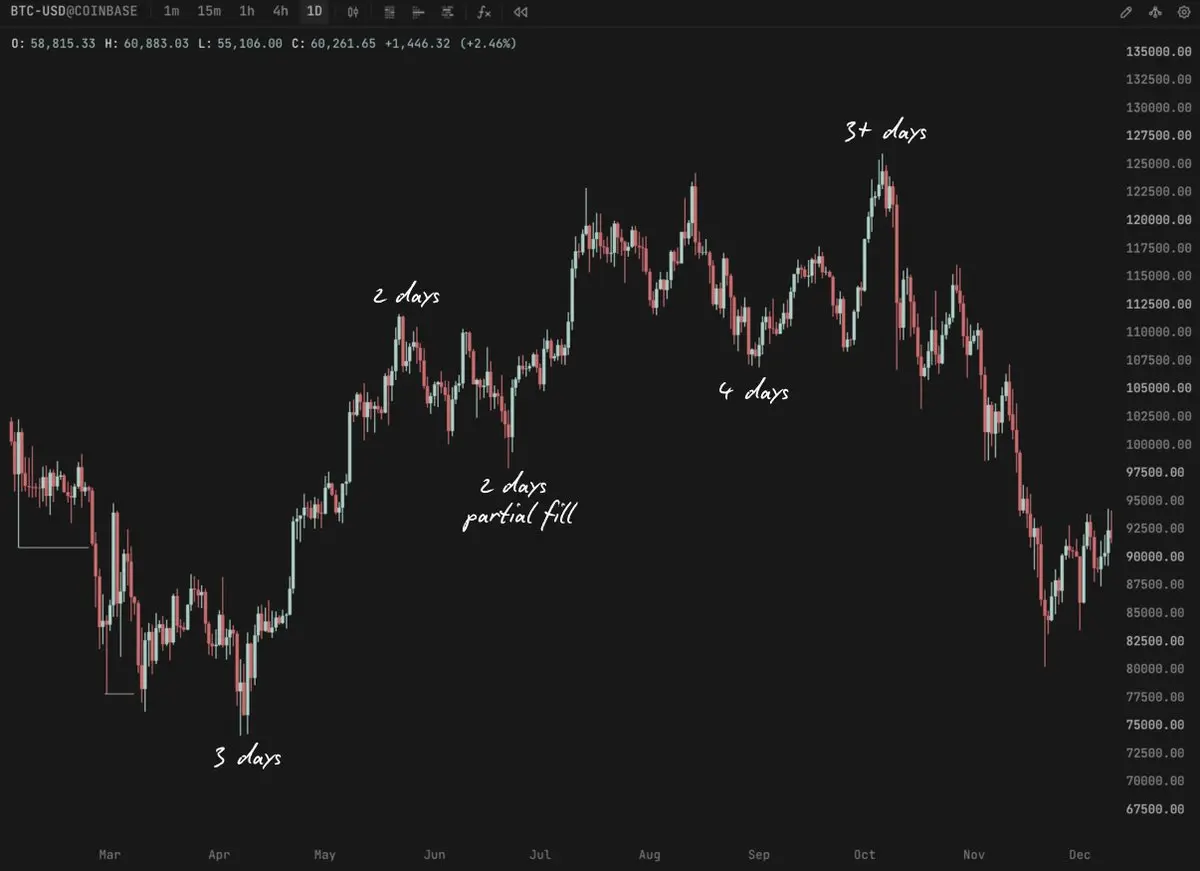
It is important to note that a medium to long-term bottom is likely to take at least a few days to form. At least for Bitcoin, it is extremely rare for a macro bottom to form immediately based on a single daily candle's V-shaped reversal. The likelihood is very low, but not impossible.
This also gives me at least a day or so to analyze whether we have established a "good low." No huge wicks, a larger bottom candle body, and accompanied by excessive liquidations. If I see these, it does not mean I will immediately go long, but it helps to rule out and narrow the probability of the price continuing to move lower. It also allows me to slightly shift my focus in the following days toward more favorable long opportunities with larger upward targets.
Common Patterns
These are the patterns I mainly want to look for after a good turning point has formed, within slightly lower time frames. You can also trade them on a macro level, but I find that the success rate is much higher when trading them internally.
1/ Anticipated Rebound
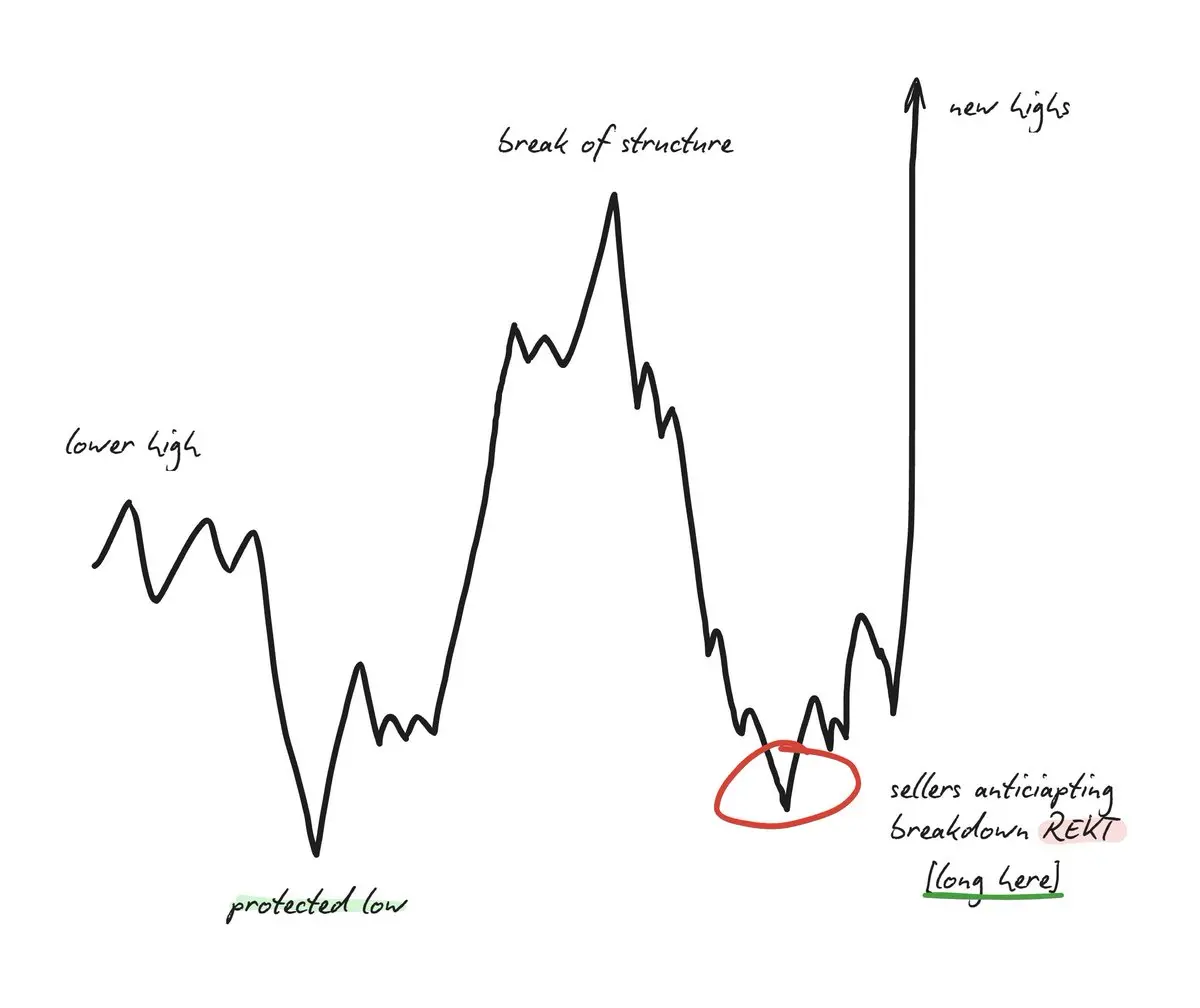
If I have already seen a good low in the market (as mentioned earlier), I will consider it "protected," and breaking below it would invalidate the argument that "a local bottom has formed."
This might be my favorite pattern. In its simplest form, the price violently moves toward the major low, absolutely enticing newcomers into new short positions, and then completely reverses to liquidate them.
You want to see an increase in open contracts, as this proves that new shorts are entering near the low. If the price moves in the opposite direction, they will gradually be forced to close, which will fuel the reversal. To close out the shorts, you must go long.
2/ Huge Wick Stop Loss Sweep
As I mentioned earlier, the initial huge wicks are usually inefficient price action, and I expect the price to come back to fill them. I am not too keen on buying at the first wick; I prefer to wait for the price to drop back down through it and sweep below the low.
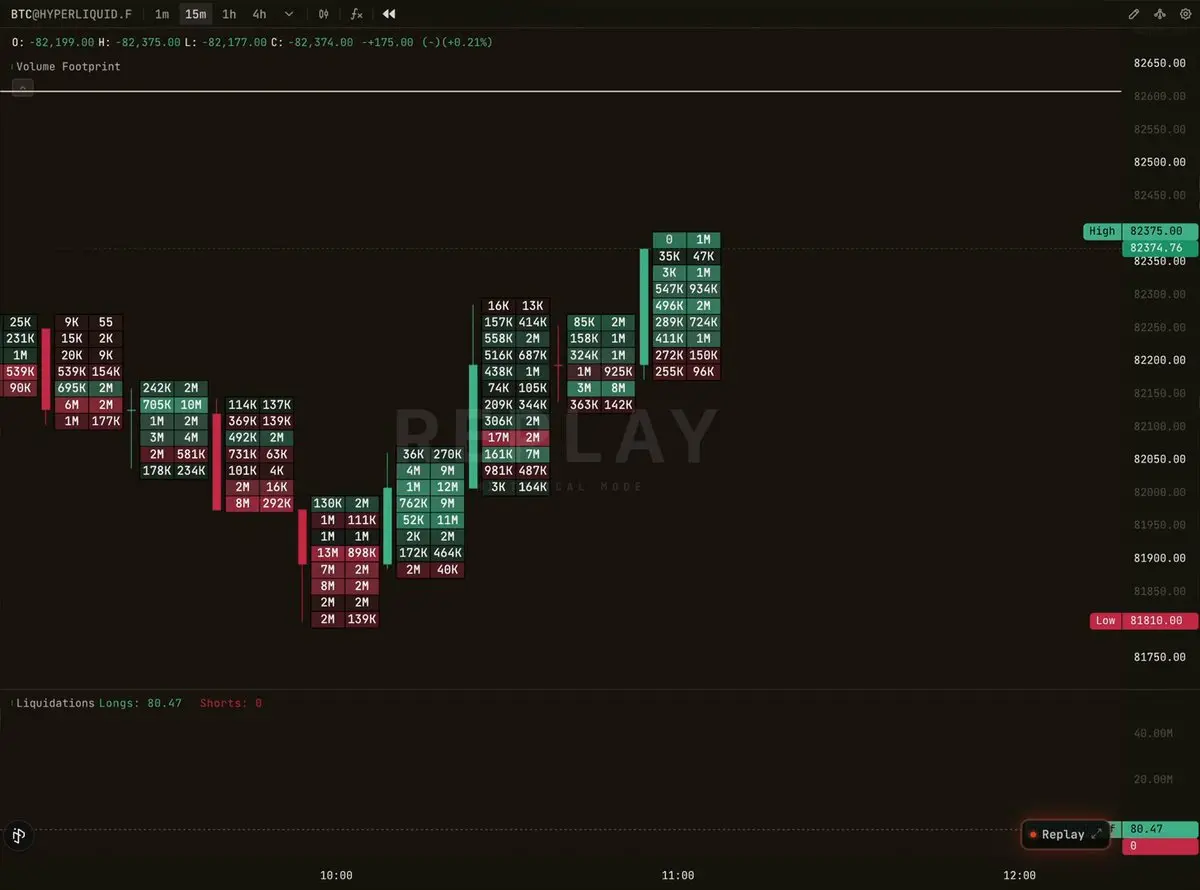
In this case, I look for failed auctions below the wick. The price trades below the old low, tests new sellers (who then get trapped), and fails to find any real acceptance there. On the footprint chart, you want to see a large amount of market selling while open contracts increase. The price reclaims above the old wick low on a candle with a larger body. Because the inefficient wick has been filled and the auction below has failed, this turns it into a good low that I can consider protected.
Here is a real-time example showing the opposite situation: new longs opening, forming an upward failed auction.
3/ Cypher Harmonic Pattern
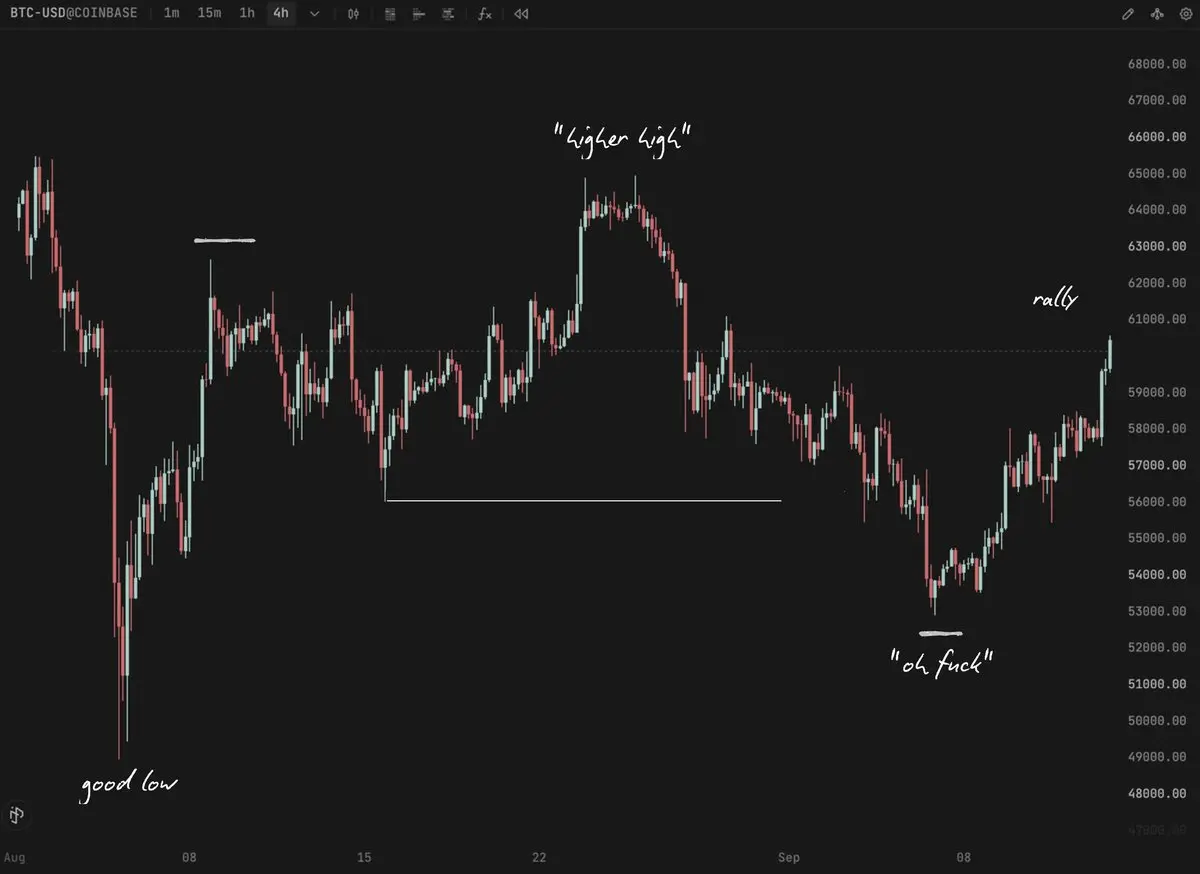
I rarely trade harmonic patterns, but I become very interested when they appear alongside a good low or high. They occur more frequently than you might think.
Harmonic patterns are not just price fractals; they also reflect human emotions being harvested. In this case, it seeks those who expect the structure to simply continue and form higher lows, mainly getting trapped, but the price instead pulls back much deeper to the protected low before ultimately rising.
Sentiment
Sentiment is poor.
Has the bottom already formed?
I do not know; for now, I would say it is likely not yet.
As of now, we have seen a huge downward daily wick. Based on what I mentioned above, this means "likely expecting lower," or at least a partial fill. Meanwhile, we have seen the price unable to break the previous day's high for 16 consecutive days.
However, we still have not formed a range that lasts for several days or weeks. I would prefer to wait for a better low to form, which I believe is protected, before looking for any intraday trading opportunities. On the other hand, shorts can be taken during rebounds, with the larger target being to fill any larger downward wicks created by the price.
If there are any changes, I will update below this content 🫡