
Zcash fell 21% from its peak, pressured by ETF fund outflows and rumors of North Korean hackers, but this wave of market activity may not be over yet
Original Title: Zcash Drops 21% From Recent High---Here's Why the Rally May Not Be Over
Original Author: Decrypt
Original Compilation: Deep Tide TechFlow
Deep Tide Introduction: Zcash has pulled back 21% after a 253% surge, with Grayscale ETF seeing over $30 million in outflows in a single day, compounded by suspected North Korean hackers using its privacy pool to transfer stolen funds------under triple pressure, the market is most concerned about: is this a pullback or an end? This article dissects on-chain data and indicators to help you determine whether this wave of privacy coin market still has a second half.
Zcash had a tough day on Thursday. ZEC is currently priced at $1333.50, down 7.29% within the day, with about three hours left until the daily close.
This means that this privacy coin has retraced about 21% from its peak of $1698.00 reached at the end of September. At the same time, this also shows how fiercely ZEC had risen before: it climbed about 253% from a starting point of $480.72 to reach that high.
The overall market hasn't given much breathing room either. Bitcoin surged to $85,600 after Wednesday's PCE inflation data came in below expectations, then quickly retraced its gains. The 10-year U.S. Treasury yield closed at 5.29%, and according to CME FedWatch data, the probability of a Fed rate hike in October has dropped from 70% to below 50%.
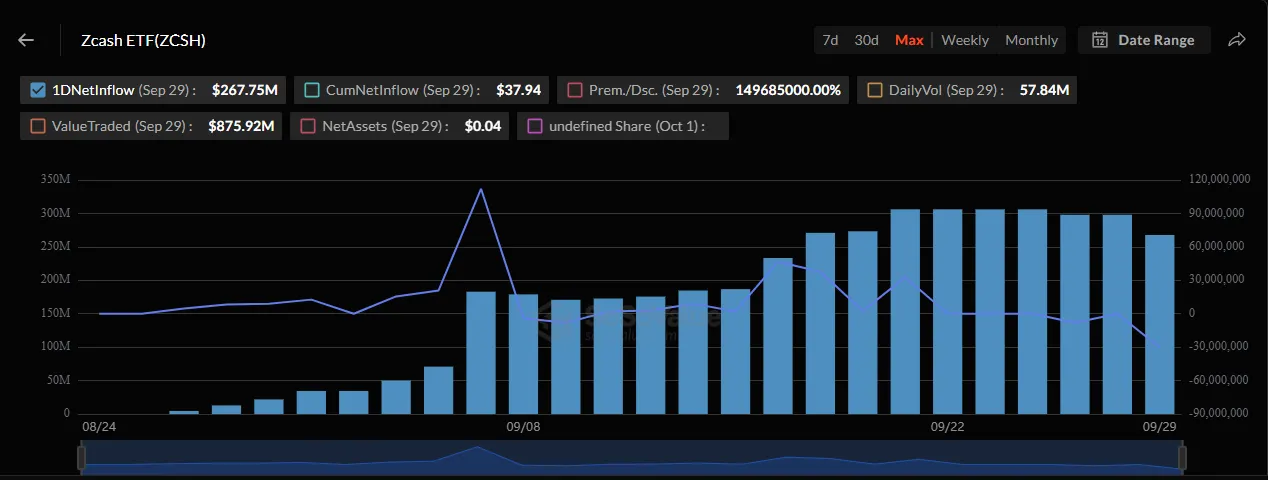
First, let's look at the ETF's funding situation. Grayscale launched the Zcash ETF, code ZCSH, on August 25, which attracted a net inflow of $233 million by mid-September.
Yesterday, the fund recorded a net outflow of $30.25 million, bringing the cumulative net inflow down to nearly $268 million. That morning, its 3-for-1 stock split also officially took effect.
The Bitget hack is another factor to consider, especially regarding market sentiment. A group of hackers stole about $387 million from the exchange on September 24, exceeding the initial estimate of $351.6 million------as more transfers were later discovered on the Zcash and Tron chains. The CEO of Bitget stated that the attack aligns with the characteristics of North Korean hacker groups, but exact attribution is still under investigation.
This is undoubtedly bad news for a cryptocurrency eager to establish a good image on Wall Street.
On Wednesday, blockchain investigator ZachXBT flagged 2,746 ZEC (about $3.9 million) flowing into Zcash's privacy pool from addresses associated with the hackers------where the sender, receiver, and amount are all hidden.
This hacking incident is unlikely to be the trigger for today's drop; the scale of $3.9 million is relatively limited, but it certainly hasn't helped.
What the Charts Say
Overall, Zcash is still in a strong bullish pattern, but the price action over the past five days is pointing towards a significant correction.
The Relative Strength Index (RSI) is a momentum indicator ranging from 0 to 100. The current reading is 50.2, sitting in a completely neutral zone, indicating that ZEC is neither overextended nor oversold. From a technical perspective, this is a relief compared to the sustained overbought readings during the previous rally.
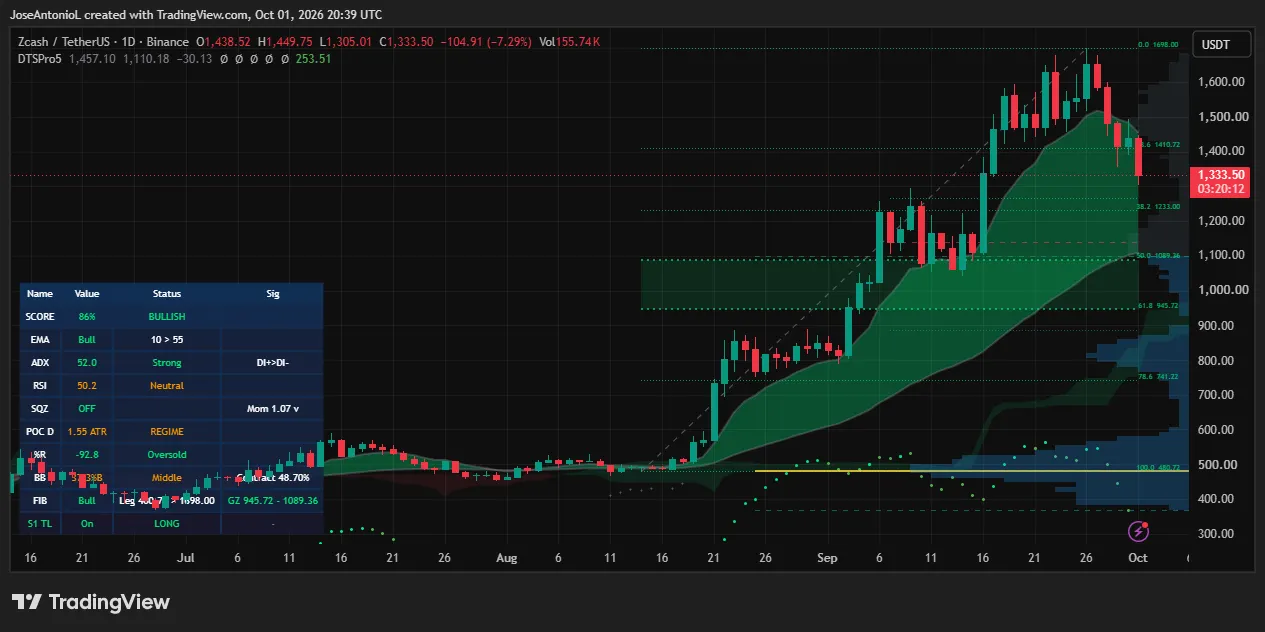
The Average Directional Index (ADX) reading is 52.0. ADX measures trend strength rather than direction, with any reading above 25 considered a true trend. A reading of 52 is very strong, but it mainly reflects the previous vertical surge, and since ADX is lagging, it may remain high even as prices decline.
The Exponential Moving Average (EMA) tracks average prices but gives more weight to recent days. The 50-day EMA is still above the 200-day EMA, keeping the trend structure bullish on paper.
If the downtrend continues, these two lines will converge------this is usually how trend changes first manifest. However, to get to that point, Zcash would need a sustained and rapid decline, which is unlikely to happen in the short term.
Is the Market Over or Is It Worth Buying the Dip?
A 21% pullback after a 253% sprint is not uncommon. In June, ZEC fell from $635 to an intraday low of $309 after a critical vulnerability in the privacy pool was disclosed. It then climbed all the way up, eventually breaking through $1600.
So at least for now, the chart interpretation seems more like a pullback rather than a crash. Trend indicators have not flipped bearish, but momentum has cooled, and the ETF just recorded a net outflow of $30.25 million.
If the daily close is below $1233.00, a golden zone will be activated; if it can regain $1410.72, it indicates that this wave of market has returned to the right track.
The views and opinions expressed by the author are for reference only and do not constitute financial, investment, or other advice.
