What are Tokenized Assets? How does the RootData Tokenized Asset Dashboard help you track cross-market data for stocks and RWA?
Tokenized assets are a category of assets that map traditional financial assets such as stocks, gold, and ETFs onto the blockchain in the form of tokens. The RootData Tokenized Asset Dashboard integrates cross-platform market share, sector heat, Ticker panorama, and individual asset details into a unified view, helping investors track this emerging market in one stop. This article introduces what data this sector covers, who it is suitable for, and how to use it.
What are Tokenized Assets? How does the RootData Tokenized Asset Dashboard help you track cross-market data for stocks and RWA?
Tokenized assets are a category of assets that map traditional financial assets such as stocks, gold, and ETFs onto the blockchain in the form of tokens. The RootData Tokenized Asset Dashboard integrates cross-platform market share, sector heat, Ticker panorama, and individual asset details into a unified view, helping investors track this emerging market in one stop. This article introduces what data this sector covers, who it is suitable for, and how to use it.
Who is the Tokenized Asset Dashboard suitable for?
- RWA investors: Want to participate in tokenized stock and tokenized gold trading but don't know which platform or sector to choose;
- Stock derivatives traders: Need to compare contract depth, funding rates, and leverage for the same asset across multiple exchanges;
- Trend researchers: Want to observe which sectors TradFi funds are flowing into, such as growth stocks, AI, or defensive assets;
- On-chain analysts: Need to track the position-opening and position-closing activity of whales in tokenized assets.
Why do we need a dedicated tokenized asset data tool?
Since 2025, tokenized stocks have rapidly flooded into crypto exchanges. The same stock may exist in multiple forms: real stock spot, tokenized stock, and stock derivative contracts launched by exchanges. There are significant price, depth, and fee differences between different forms, and the same asset may span more than ten issuers and exchanges.
For investors, this creates three blind spots: Which exchange has the largest TradFi trading volume? Which sector is heating up? Where is the best depth for the same asset? Traditional market tools only cover a single venue, while on-chain browsers cannot see CEX contract data, and cross-platform comparisons can only be manually pieced together. This is precisely the problem that the RootData Tokenized Asset Dashboard aims to solve.
What data does the RootData Tokenized Asset Dashboard cover?
Open the Tokenized Asset Dashboard , and you can see four core modules.
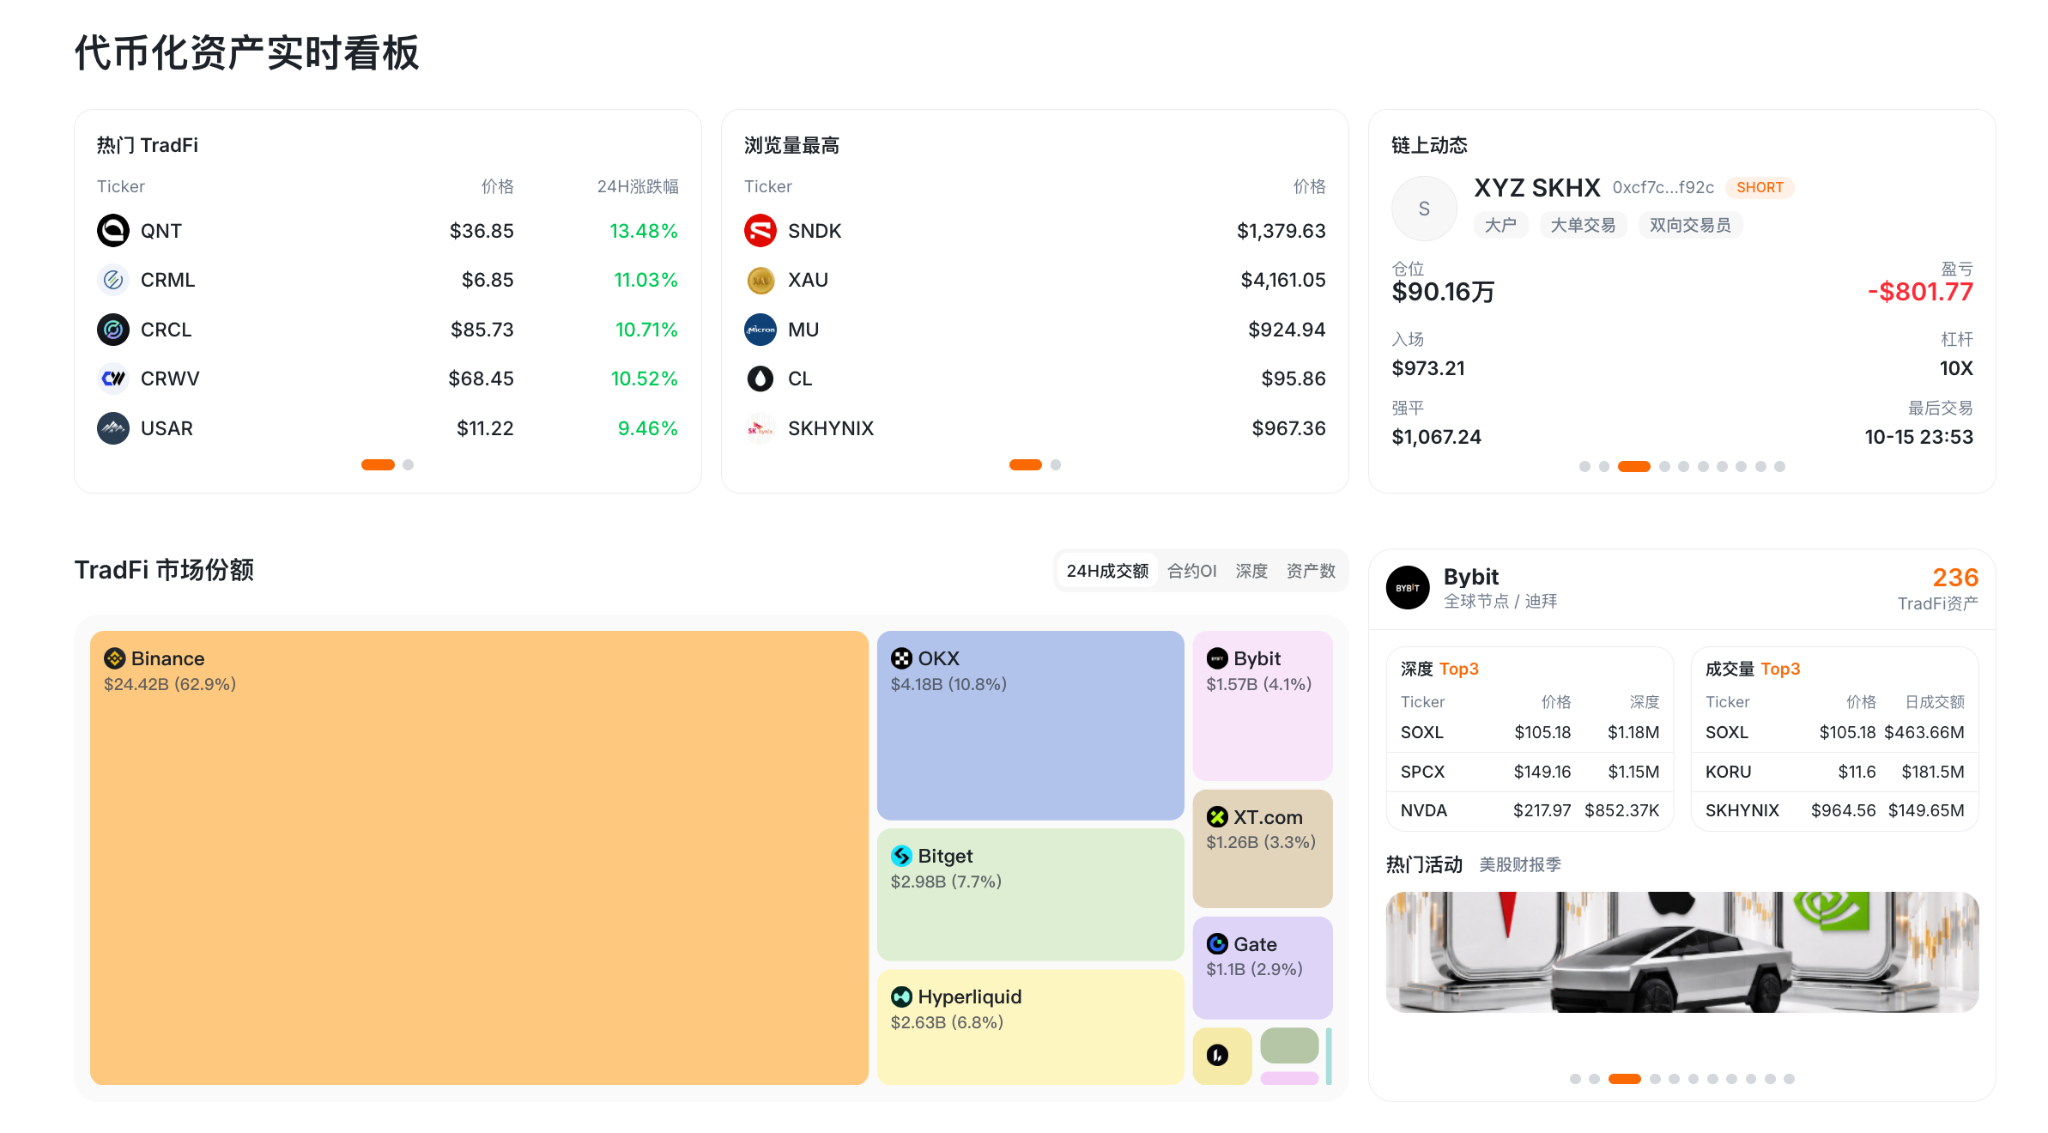
1. Real-time Tokenized Asset Dashboard. Aggregates three types of real-time information: popular TradFi assets (sorted by 24H price change, such as NET, DDOG, OPENAI, etc. Ticker), the most viewed assets (reflecting market attention), and on-chain dynamics, reporting in real-time the position changes of whales in stock derivatives, including direction (long/short), position size, entry price, leverage, and profit/loss.
2. TradFi Market Share. Displays the 24H trading volume share of each exchange in stock spot and stock derivatives using a rectangular tree map, with the ability to switch perspectives by 24H trading volume, contract OI, depth, and number of assets. Clicking on a single exchange also reveals its total number of TradFi assets, top 3 depths, and top 3 Tickers by trading volume, along with platform highlights. This module complements the stock derivatives exchange ranking and stock spot exchange ranking evaluation system, helping users see the real-time situation of TradFi assets on exchanges.
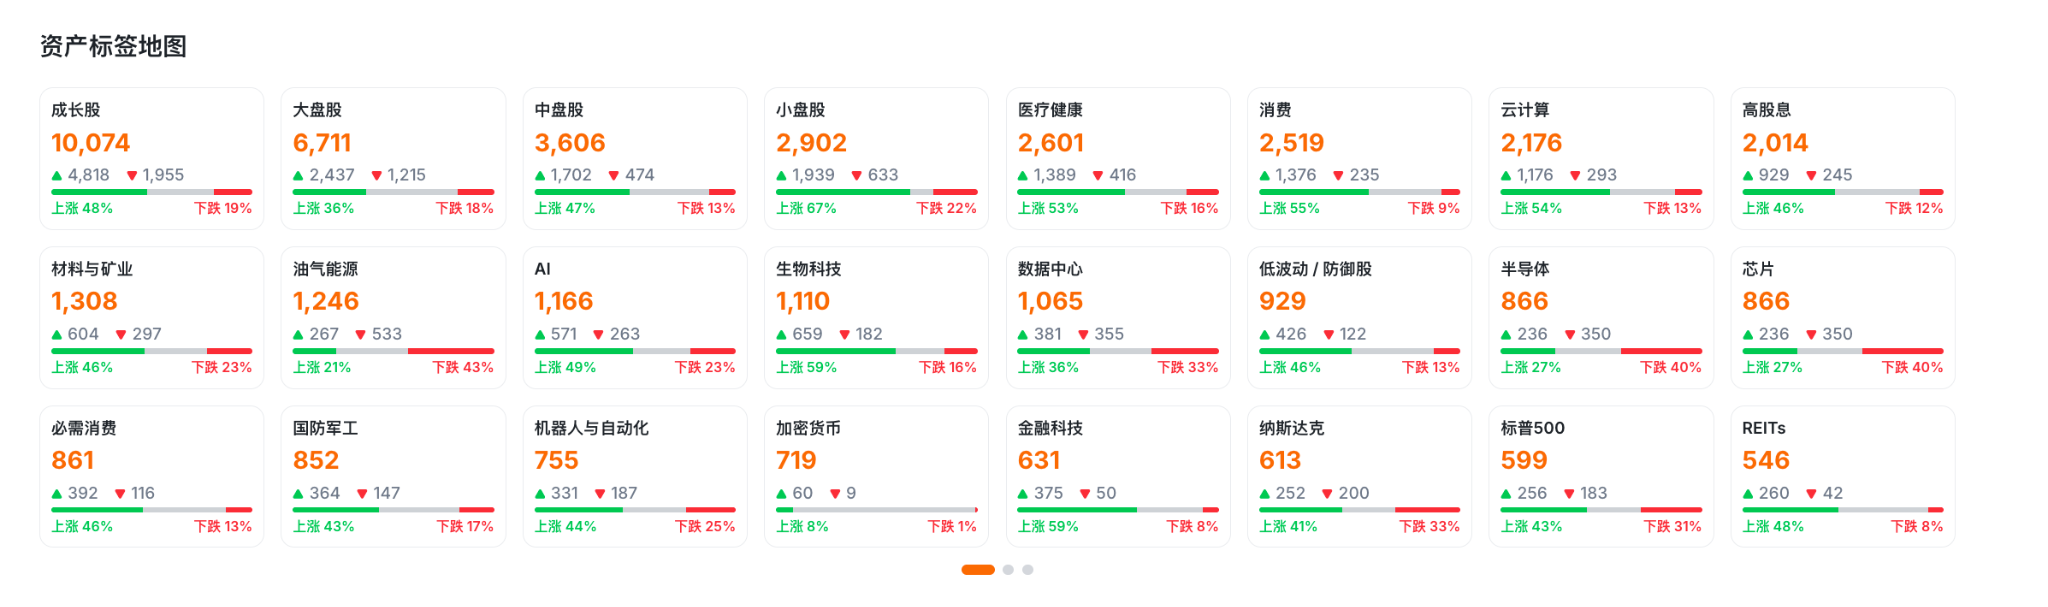
3. Asset Tag Map. Statistics on the number of assets and price change distribution by sector, covering more than 20 tags including growth stocks, large-cap stocks, mid-cap stocks, small-cap stocks, healthcare, consumer, cloud computing, high dividends, AI, oil and gas energy, semiconductors, chips, etc. Each sector marks the proportion of rising and falling assets, visually presenting sector heat.
4. Ticker List and Asset Detail Page. The Ticker list supports searching and filtering by supplier and asset category, including four categories: real stock assets, ETF spot assets, tokenized stock assets, and stock contract assets; the list displays the number of suppliers, tags, prices, 24H price changes, trading volume, and market capitalization for each Ticker.
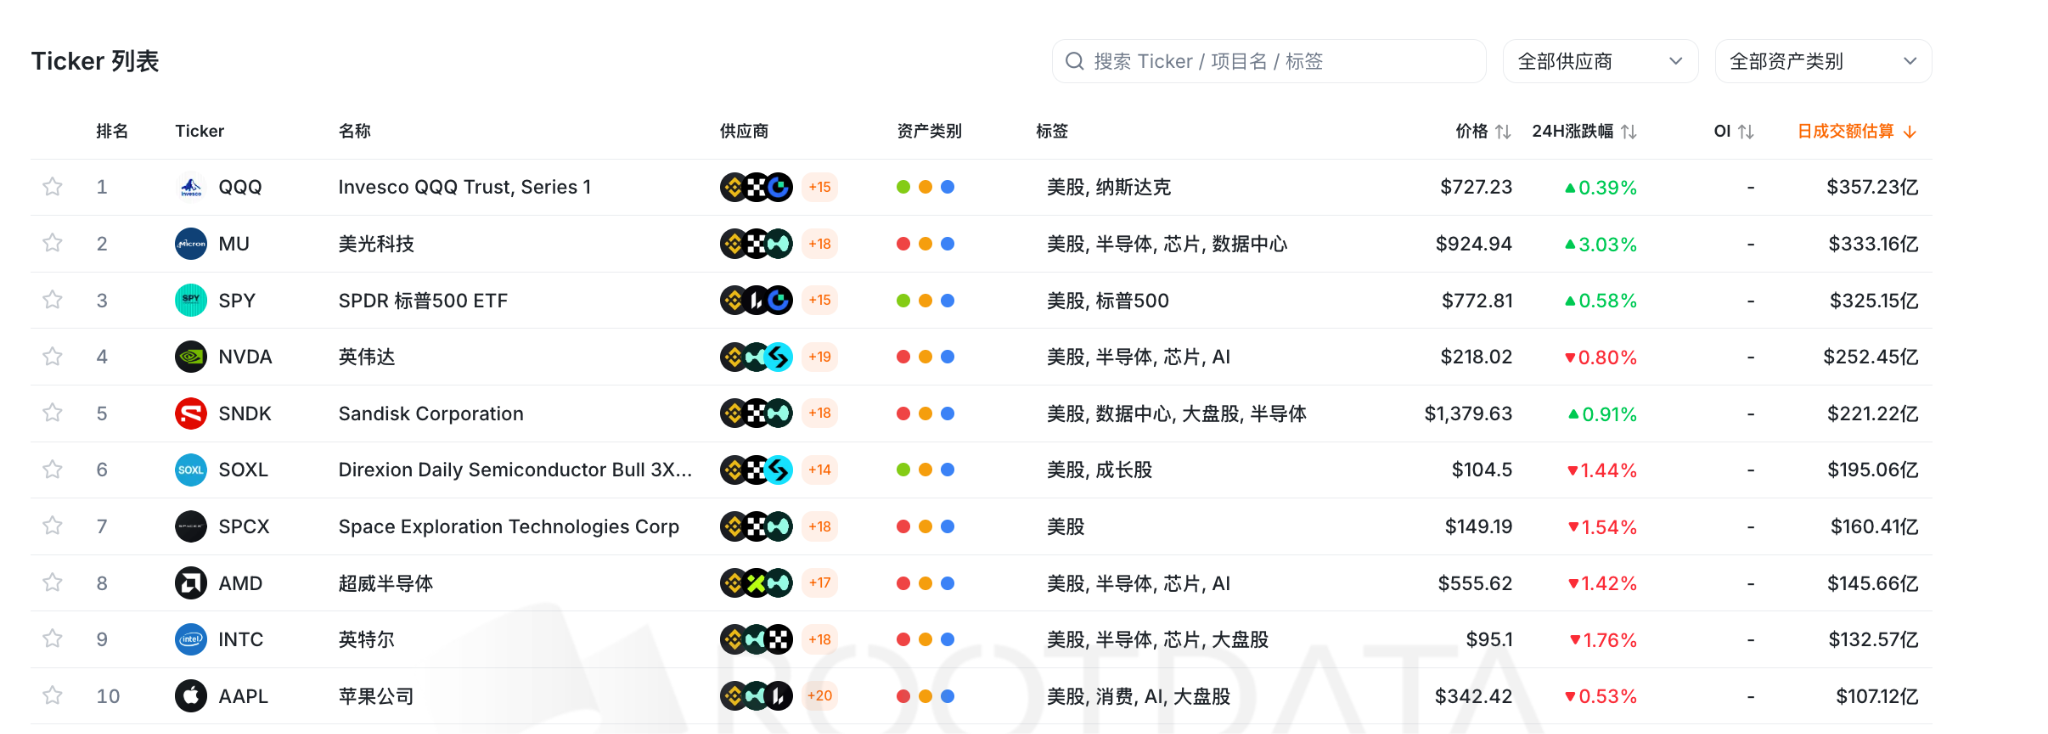
Clicking on any Ticker enters the detail page, where you can view complete data:
- Stock Contract Overview: Compare the price, spread, liquidity, 24H trading volume, OI, funding rate, maximum leverage, and fees of the same asset across various exchanges;
- Tokenized Stock Assets: Compare prices, issuance volumes, and AUM of issuers like Ondo, Coinbase, bStocks, xStocks across different chains;
- Real Stock Assets: Display real stock trading pairs and trading hours, fees from exchanges like Binance and Gate;
- Financial Report Visualization: Present quarterly changes in revenue, net profit, gross margin, free cash flow, and income profit bridge, helping users reference the fundamentals of the underlying company while trading tokenized assets;
- On-chain Dynamics: Monitor the position changes and profit/loss of related addresses.
Three Typical Use Cases
Choosing a Platform: Quickly confirm which exchanges carry the main trading volume through the TradFi market share tree map, then combine the contract depth and fee data from the detail page to find low-slippage trading venues.
Choosing a Sector: Discover sectors where funds are flowing in through the asset tag map, then enter that sector to select specific Tickers.
Following Funds: Combine the on-chain dynamics from the real-time dashboard with the whale position data from the detail page to observe large funds' long and short layouts in stock derivatives as trading references.
Usage Restrictions
- The screenshots and data points in this article (such as the number of assets in sectors, market share) are taken from the page display on October 16, 2026, and real-time data should be based on the dashboard;
- Some newly launched Tickers may have unfilled data (such as prices and trading volumes displayed as "-") which does not indicate that the asset has no trading;
- Market share is calculated based on 24H trading volume, reflecting only short-term trading concentration and does not represent the comprehensive strength or compliance level of the exchange;
- Tokenized assets involve multiple issuers and cross-chain versions, and the same underlying may have price differences, so please verify the asset correspondence before trading;
- Whale movements and sector price changes are only data presentations and do not constitute investment advice.
Experience Now
Visit the RootData Tokenized Asset Dashboard , from sector heat to individual asset depth, grasp the cross-market overview of tokenized stocks and RWA in one stop.