2026 Crypto Stock Market Q4 Outlook (August–October)
From August to October 2026, stock derivatives trading volume across major platforms first declined and then rebounded, while open interest and order book depth expanded steadily. Average daily volume fell from $23.360 billion in August to $17.041 billion in September, before recovering to $19.809 billion in October, still short of the August level. Binance dominates in trading volume and open interest, but has not established an absolute advantage across multiple dimensions such as trading quality, and other major platforms hold differing strengths: OKX ranks second in both trading volume and spreads, while Bitget leads in ±2% depth. Competition has diverged along the lines of scale, product coverage and liquidity. Tokenized stock spot products show clear differences in trading channels, dividend handling and disclosure. The five issuers each have a distinct focus: Ondo, bStocks and xStocks lead in asset size, while Reality offers the broadest product coverage and the most diverse exe
I. Market Overview and Demand Structure
In Q3 2026, global equity markets repeatedly adjusted between earnings growth and macro tightening. The Federal Reserve raised rates by 25 basis points to 3.75%–4.00% in September and held rates unchanged in October, but expectations of a further hike in December remain, making the rate path the core variable for Q4. At the sector level, AI-driven storage demand and product price increases supported the rally in storage names such as SNDK and MU; after October, market concerns over returns on AI capital expenditure intensified, and tech stock volatility increased.
Looking ahead to Q4, the U.S. midterm elections, the Anthropic IPO and expectations that OpenAI's listing has been pushed back to 2027 may continue to affect tech stock valuations and trading hotspots. Against this backdrop, it is worth reviewing the trading volume, competitive landscape and liquidity of stock derivatives and tokenized stock spot on crypto trading platforms, and assessing each platform's capacity to absorb newly listed assets and event-driven trading demand.
1. Stock Derivatives Market
1.1 Trading Volume and Peaks
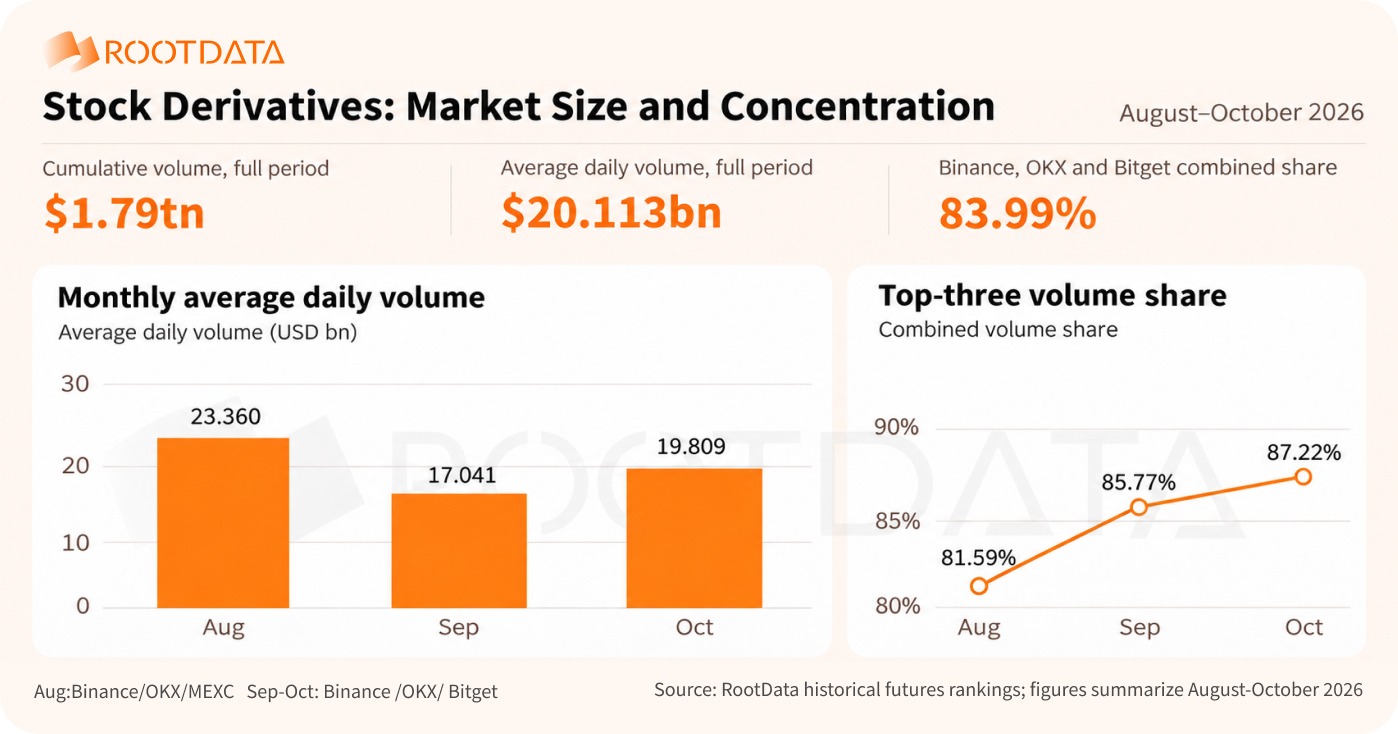
From August to October 2026, stock derivatives trading volume across the eight major platforms totaled approximately $1.79 trillion, or $20.113 billion per day on average. Trading was concentrated on the leading platforms, with Binance, OKX and Bitget accounting for a combined 83.99% of volume.
On a monthly basis, market volume contracted in September and recovered in October, with October's average daily volume up 16.24% month-over-month, though still below the August level. In terms of concentration, the combined share of the top three platforms by volume rose from 81.59% to 87.22%, indicating further concentration among the leaders.
Table 1:
1.2 Open Interest, ±2% Depth and Peaks
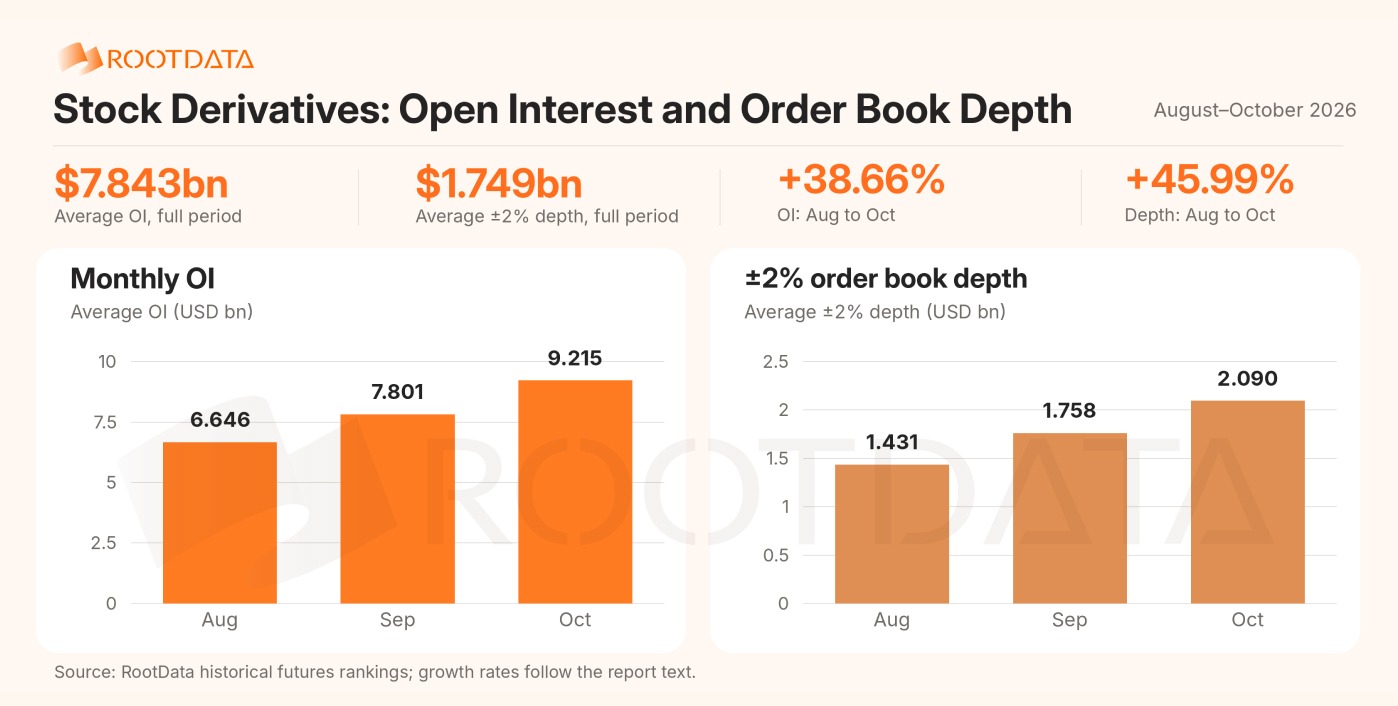
From August to October, average daily open interest (OI) across the eight major platforms was approximately $7.843 billion, and combined average daily ±2% order book depth was $1.749 billion. In contrast to volume, which fell before rebounding, OI and order book depth grew consecutively, showing more sustained expansion.
In October, average daily OI reached $9.215 billion, up 38.66% from August; average daily ±2% depth reached $2.090 billion, up 45.99%. During September's volume pullback, OI and resting orders continued to increase, indicating that capital did not exit on a large scale: traders shifted more from short-term turnover to holding positions, and market-making and order supply also kept expanding. Platform liquidity foundations were unaffected by the volume contraction, which may have supported October's volume recovery.
Table 2:
1.3 Popular Stock and ETF Contracts
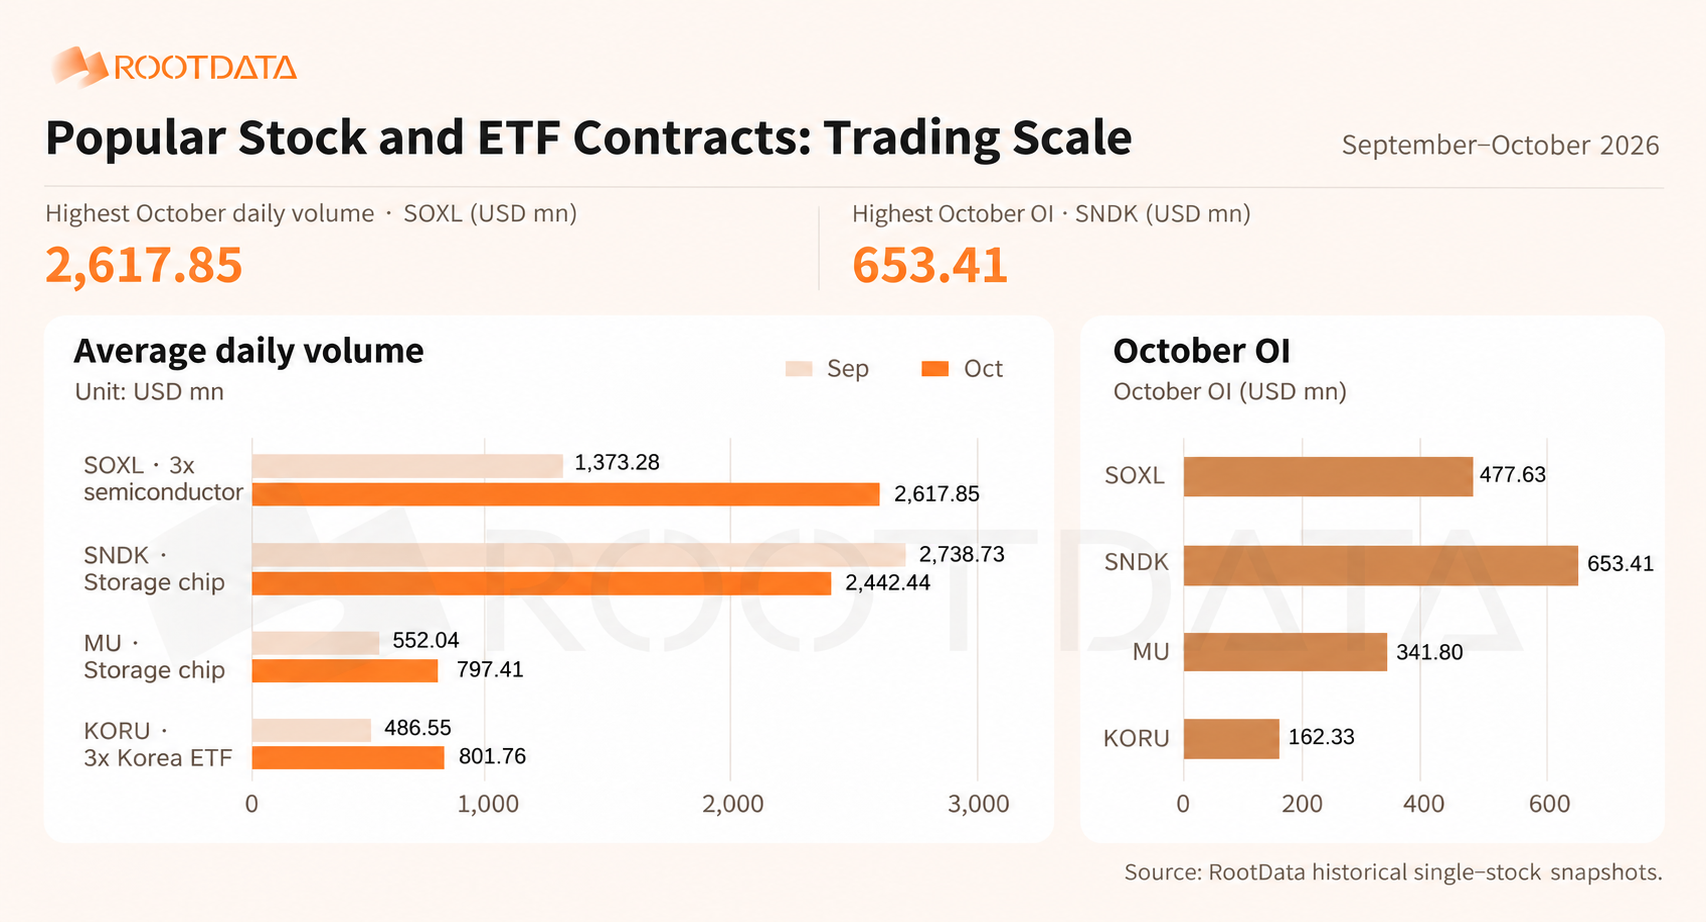
In September–October, single-name trading was concentrated in semiconductors, storage and leveraged ETFs. SOXL and SNDK recorded average daily volume of approximately $2.618 billion and $2.442 billion, respectively, across the eight sample platforms, ranking at the top as the most actively traded stock assets.
Table 3:
Sign in to unlock the full article
Sign in to unlock the complete research report and PDF download
This report is for informational purposes only and does not constitute investment advice, an offer, or a commitment of any kind. The information, data, opinions, and forecasts herein are based on publicly available sources and the authors’ independent analysis. While we have made reasonable efforts to ensure accuracy, completeness, and timeliness, no express or implied warranty is given. Market conditions, regulations, and subject circumstances may change at any time; past performance is not indicative of future results. Readers should exercise independent judgment and bear their own decision-making risks. The institution and the authors accept no liability for any direct or indirect losses arising from the use of this report. Reproduction, redistribution, or commercial use without prior written consent is prohibited.