
Galaxy Research Report: The Bitcoin bear market bottomed out in June, quick money has withdrawn completely, and the selling pressure from old coins has halved; now is the time to increase positions and hold
Author: Alex Thorn (Global Research Director at Galaxy)
Compiled by: Deep Tide TechFlow
Deep Tide Guide: As the market oscillates between chaos and calm, true macro strategic turning points often quietly establish themselves in the neglected valleys. In this in-depth report, Alex Thorn, the Global Research Director at Galaxy, uses multidimensional data to demonstrate why now is the best window to buy and hold Bitcoin for the long term.
From a technical perspective, the 200-week moving average has once again been tested as a solid bottom, reclaiming the 50-week moving average after 44 weeks of silence, forming a strong resonance with the bottom time window of the four-year halving cycle;
In terms of chip and capital structure, data from CME futures and 13F filings show that the fast money driven by basis arbitrage and macro speculation has largely exited, while sovereign funds and long-term allocation accounts continue to accumulate, resulting in an increasingly solid holding structure after washing out the froth;
On the macro fundamental front, the U.S. federal debt has surpassed $40.44 trillion, with annual interest payments reaching $1.28 trillion. The expansion of sovereign debt and the credit overextension of AI infrastructure are irreversibly driving the structural devaluation of fiat currency;
In the sentiment cycle, Wall Street has fallen into the cognitive trap of "wanting blockchain, not Bitcoin" for the third time, ignoring the fundamental value of censorship-resistant, non-sovereign native hard assets amidst the frenzy of stablecoins and asset tokenization.
History has shown that every divergence between technological euphoria and asset neglect gives birth to the next grand super upward cycle of Bitcoin.

This research alert was initially sent directly to clients of Galaxy Trading and Galaxy Asset Management on October 22, 2026. Please note that the data and prices cited in this article are based on October 22, 2026. By trading or investing with Galaxy, you can receive the most timely research results directly in your inbox.
Core Summary
Bitcoin traded at $81,391 yesterday (October 22, Thursday), down 3% from Wednesday's closing price of $84,176. At Thursday's price, Bitcoin has retraced 35% from its historical high in October 2025 and is up 39% from the low reached on June 30, 2026. We believe that this bear market officially ended in June, and Bitcoin is currently in the accumulation phase that precedes every major upward wave.
On a technical level, the 200-week moving average support has effectively held, and the 50-week moving average has successfully reclaimed for five consecutive weeks. On the 916th day of the halving cycle, Bitcoin has smoothly passed through the typical time window for finding bottoms in previous cycles.
The holding structure indicates that selling pressure has largely cleared: basis arbitrageurs and macro-following speculators who went long at the October 2025 high have reduced their ETF and futures exposure by more than half, while other long-term holders have largely chosen to hold firmly. In contrast, global stock markets are currently near historical highs, while Bitcoin only needs to rise 53% to reclaim its historical peak.
The fundamental logic is becoming increasingly strong: a sovereign nation burdened with a 5% treasury yield and maintaining an annual fiscal deficit of $2 trillion has a rising probability of pushing for fiat currency devaluation in the interim. Shorting stocks and hard assets essentially bets against fiat currency, which is precisely the only illogical position in the current macro environment. Furthermore, market sentiment has once again tilted towards the narrative of "wanting blockchain, not Bitcoin," and in the previous two instances of similar shifts, they invariably marked the historical bottom of the cycle.
Our conclusion is very clear: we firmly believe that now is an extremely attractive strategic time to buy and hold Bitcoin for the long term.
At the end of last month, I attended Korea Blockchain Week, a fantastic industry event that fully showcased the immense and growing interest in digital assets within the Korean market. Despite the high enthusiasm on-site, the core topic of the entire conference was highly focused on one theme: the deep integration of digital assets with traditional capital markets.
The conference arranged dozens of roundtable discussions on tokenization, real-world assets (RWA), stablecoins, and upgrades to payment infrastructure. I participated in one of the few panels focused on Bitcoin and the cryptocurrency market. This reminded me of the Consensus conference held in New York in 2018, where the venue was filled with professionals in suits from the three major consulting firms, passionately discussing "enterprise-level blockchain" concepts like R3 Corda and IBM Hyperledger.
After the peak and crash of 2017, the emotional pendulum swung dramatically from Bitcoin and cryptocurrencies towards the seemingly more "mature" concept of "blockchain technology," which posed less of a threat. Earlier, during the 2015 to 2016 period (another deep bear market cycle bottom), from my perspective at Fidelity Investments, the same sentiment permeated the market: no one wanted to mention Bitcoin, but bankers were fervent about "blockchain."
The social backlash triggered by the Silk Road incident ("Bitcoin is a tool for criminals") and the stigma from the ICO bubble burst ("cryptocurrency is a scam") intertwined with the evident efficiency advantages of the underlying technology, prompting various financial institutions to steer clear of anonymous assets, censorship-resistant characteristics, and permissionless finance, instead investing in more "socially reputable" compliant transformations. At that time, Bitcoin and cryptocurrencies clearly did not perish, but like today, public and capital attention dramatically shifted away from the core spirit of decentralization towards a concept that was far less disruptive: the technological underpinnings of upgrading the traditional financial system.
Although Wall Street's attempts to embrace blockchain between 2016 and 2018-2019 ultimately yielded little, this time may be different. The current comprehensive embrace of digital assets and blockchain technology by institutions is undeniable and is likely to bring about a significantly more efficient financial system. Even so, the logic of non-sovereign, censorship-resistant hard currency should never be forgotten, as it will never fade away on its own.
Technical Analysis: The Bottom is Established, Accumulation is Ongoing
Bitcoin's past bear markets have followed a clear and reliable nautical chart: the 200-week moving average is a solid floor, while the 50-week moving average serves as a ceiling of resistance.
In the week ending November 16, 2025, the price fell below the 50-week moving average and lingered below it for a full 44 weeks. The low in June tested the floor support and successfully held: the worst weekly closing price was only 4.7% lower than the 200-week moving average (in comparison, it was 1.4% in 2015, 2.8% in 2018, and 32% in 2022). In the week ending September 20, 2026, the price reclaimed above the 50-week moving average; by the week ending October 18, it had achieved five consecutive weeks above it. In every complete bear market since 2011, the first sustained hold above the ceiling occurred after the cycle's bottom was established (Figure 1). Thursday's spot price of $81,391 was 6% above that moving average, and the pullback since Wednesday's close did not pose a substantial threat to the breakout results.
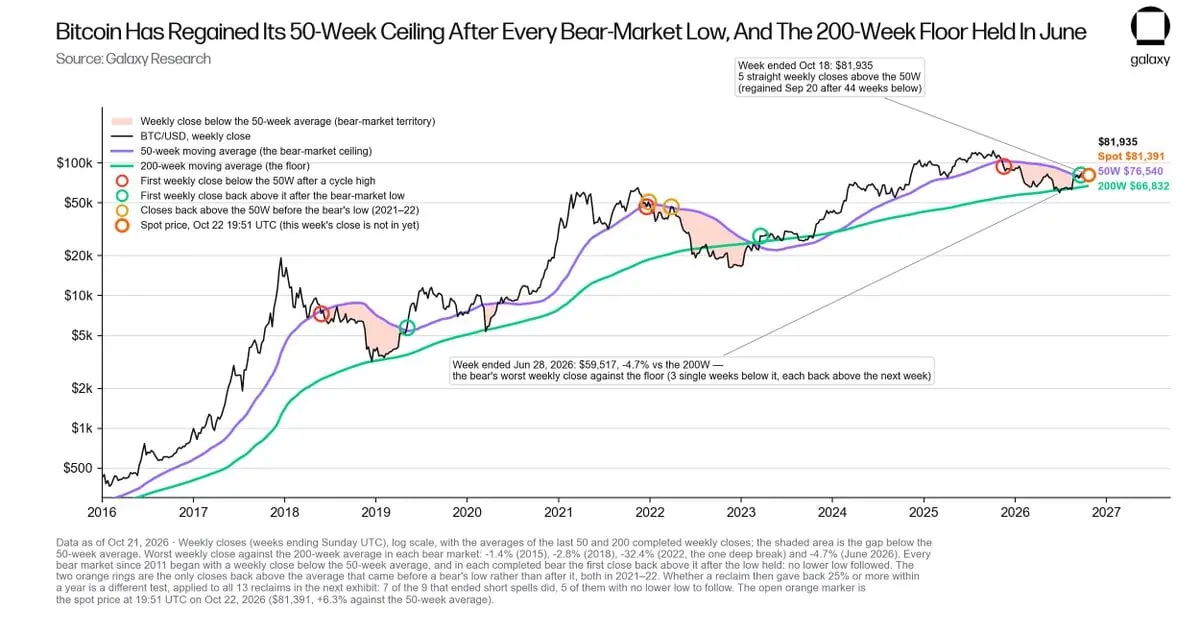
Figure 1: Bitcoin's weekly closing price relative to the 50-week and 200-week moving averages since 2016. Bitcoin fell below the 50-week moving average in the week ending November 16, 2025, tested the 200-week floor support in June (the worst weekly closing price deviated by -4.7%), and reclaimed the 50-week moving average in the week ending September 20; by the week ending October 18, it had maintained above it for five consecutive weeks. The hollow marker represents the spot price at 19:51 UTC on October 22, which is 6.3% above the 50-week moving average.
What is the probability of a new round of significant declines occurring after successfully reclaiming the moving average? Reviewing the 13 cases of reclaiming since 2011, the subsequent price movements hinge on the duration of the price being below the moving average prior to reclaiming. Among them, 4 cases that ended a period of being below the moving average for over 20 weeks exhibited strong regularity:
First, in the following year, the weekly closing price never fell more than 8.4% below the breakout level;
Second, the price increase one year later reached +1497%, +128%, +55%, and +142% respectively;
Third, all refreshed historical highs within 33 to 83 weeks.
In contrast, among the other 9 reclaims that ended a correction period of 14 weeks or shorter, 7 saw a decline of over 25% within a year. The reclaim in September of this year ended a 44-week period of stagnation below the moving average (Figure 2), and this historical pattern is highly relevant.
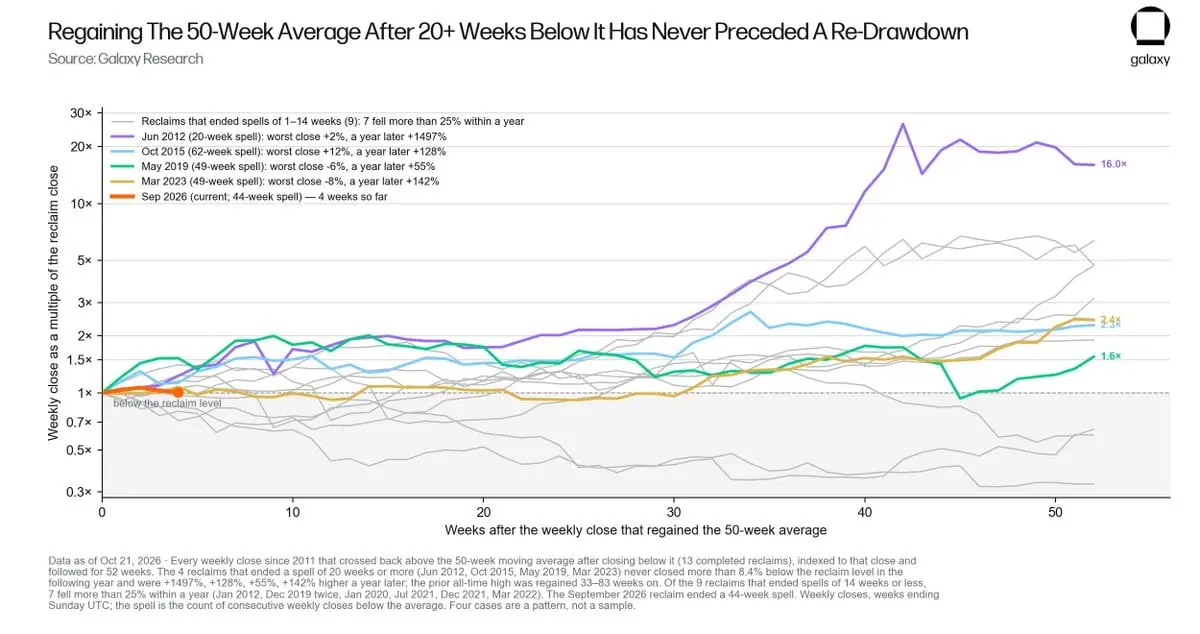
Figure 2: Tracking the price movements after each reclaim above the 50-week moving average since 2011 (with the closing price of the reclaim week as the baseline of 100, tracking period of one year). In the 4 cases that ended a period of being below the moving average for 20 weeks or more, the subsequent weekly closing price pullback never exceeded 8.4% below the breakout level; while in the 9 cases with shorter periods below the moving average, 7 saw declines of over 25% within a year. The reclaim in September of this year ended a 44-week period of oscillation below the moving average.
The four-year halving cycle also confirms this judgment. In the first three complete cycles, the cycle lows occurred on the 777th day, the 889th day, and the 912th day after the halving; while the lowest point of the current cycle occurred on the 802nd day after the halving, and yesterday was the 916th day after the halving. If we calculate from this time point, the price increases to the next peak in previous cycles reached 87 times, 19 times, and 7.6 times respectively (we do not make specific predictions about this gradually decreasing multiple relationship), but the directional operation of the cycle has never failed (Figure 3).
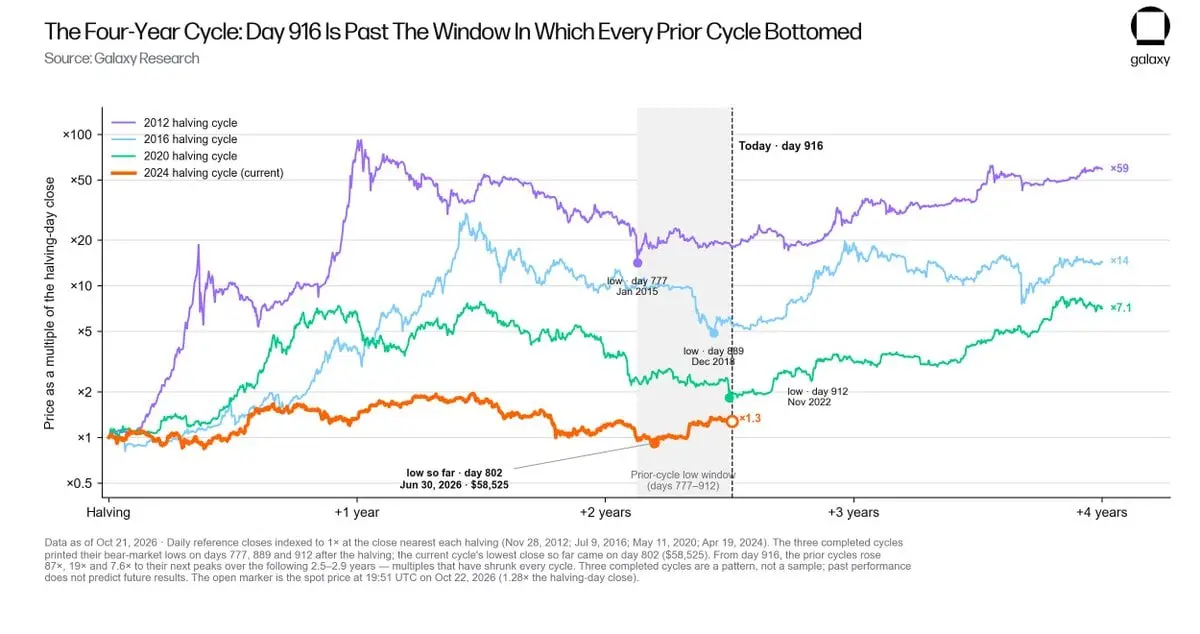
Figure 3: Relative movements of each halving cycle based on the closing price on the halving day. The lows of the first three complete cycles occurred on the 777th day, the 889th day, and the 912th day after the halving; yesterday was the 916th day of the current cycle, with the lowest closing price occurring on the 802nd day. The hollow marker represents yesterday's spot price.
This bear market is the shallowest recorded in terms of retracement (with a drop of -53%, while previous cycles had retracements of -93%, -85%, -84%, and -77%), and it is the first cycle in history where the price has never fallen below the network-wide cost benchmark: the market value to realized value ratio (MVRV) bottomed at 1.10, while in the previous three major bottoms, this ratio was as low as 0.56, 0.69, and 0.75.
The average holding cost of chips that pushed the price to stabilize and rebound from $58,525 is $74,811; on August 19, the price first closed above this cost benchmark (Figure 4), when the cost line was at $69,268. Based on yesterday's price, the floating profit of this group of holders is about 9%, with the spent output profit ratio (SOPR) only at 1.009, and there has not been a large-scale profit-taking wave, which is characteristic of a typical accumulation phase.
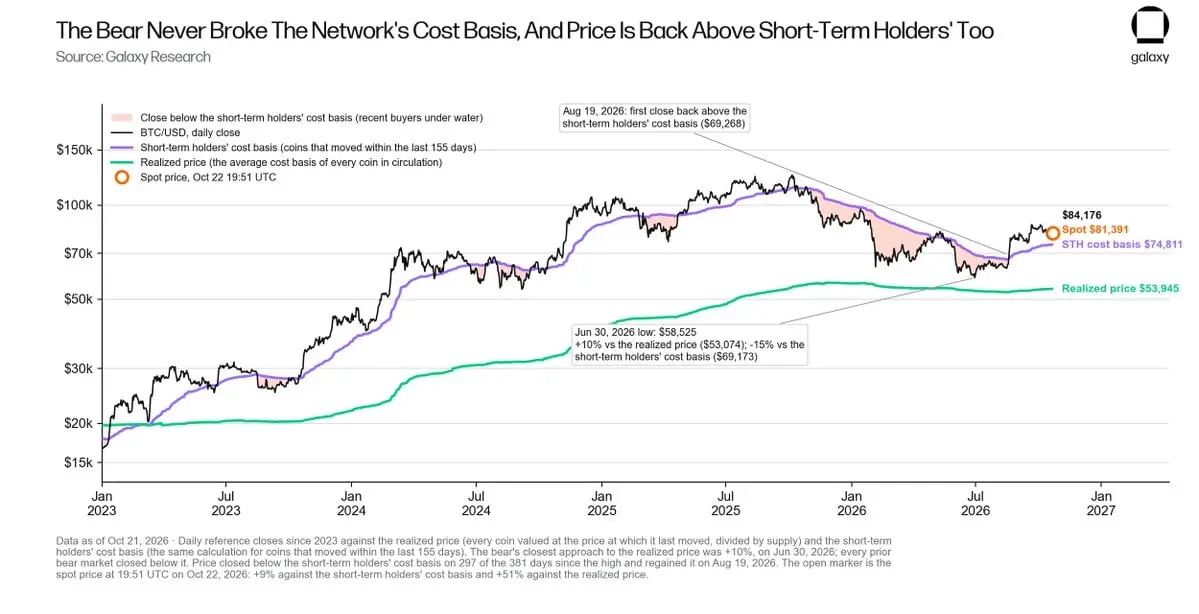
Figure 4: The trend of daily closing prices relative to realized prices and short-term holder cost benchmarks since 2023. In this bear market, the price is still 10% higher than the realized price; the price reclaimed the short-term holder cost line on August 19, with Thursday's spot price about 9% higher than this benchmark.
Meanwhile, the selling pressure that suppresses the bull market peak in 2025 is rapidly declining. Dormant chips that have been stationary for 5 years or more are flowing out at a rate of 67,000 BTC per month in 2024 and 47,000 BTC per month in 2025. Since October 2024, a total of 1.11 million BTC has been transferred, marking the largest distribution of ancient chips in history, most of which has been absorbed by spot ETFs and publicly listed companies in the Bitcoin digital asset treasury (DAT). As we enter 2026, this selling pace has dropped to 34,000 BTC per month, only 50% of the peak level in 2024 (Figure 5).
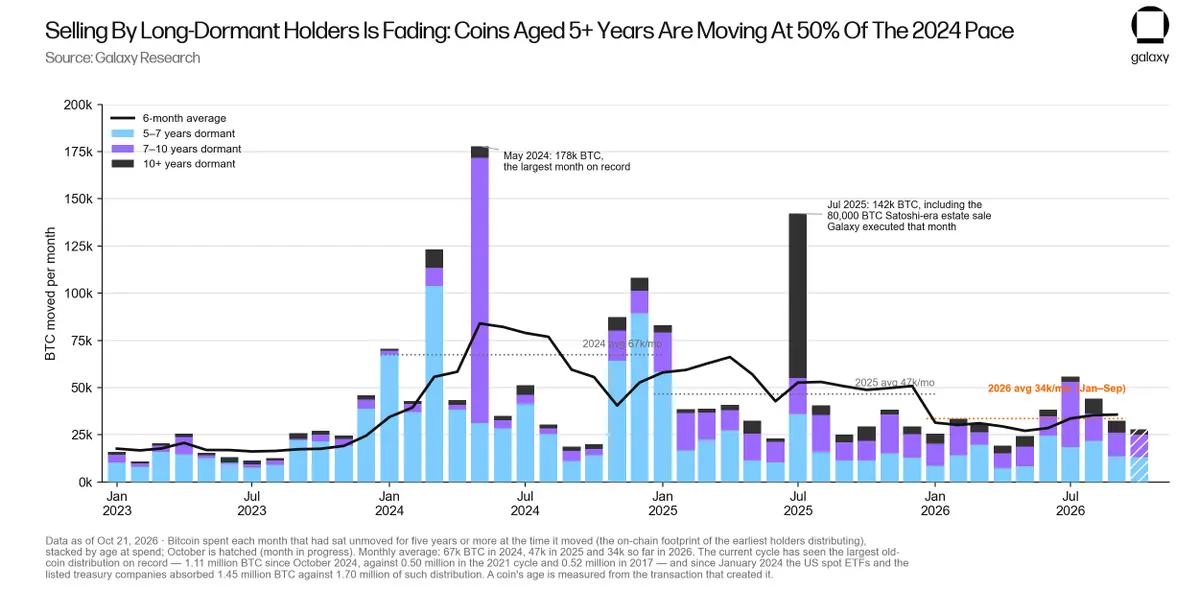
Figure 5: The number of Bitcoins that have been dormant for over 5 years and spent in various months (classified by coin age at the time of transfer). The average monthly outflow has decreased from 67,000 BTC in 2024 and 47,000 BTC in 2025 to 34,000 BTC so far in 2026.
Capital and Chip Structure: Speculative Quick Money Exits, Long-term Cornerstones Remain, Other Asset Pricing Approaches Perfection
The structure of the futures market clearly reveals how low the current macro hot money's holding ratio in Bitcoin is.
According to the Commodity Futures Trading Commission (CFTC) data on financial futures traders (TFF), during the week when it hit an all-time high, asset management institutions had a net long position of 43,300 BTC in CME Bitcoin futures, which has now dropped to 18,400 BTC (a decrease of -57%); the net short position of leveraged funds (i.e., futures short positions for spot ETF arbitrage) has also significantly reduced from 71,400 BTC to 30,600 BTC; the total open interest in the market measured in USD has plummeted by 51% (Figure 6).
The arbitrage spread that provided substantial returns for these short positions has almost been exhausted: in the 30 days before the peak, the annualized yield of the near-month contract basis averaged 7.9%, exceeding the 3-month U.S. Treasury yield by 3.9 percentage points; however, in the 30 days ending October 21, this spread has narrowed to an annualized 4.8%, only 0.6 percentage points higher than U.S. Treasuries (Figure 7).
Although the forward curve still has a slight yield space (as of October 21, the annualized basis rate for November and December contracts was about 6.3% to 6.5%, exceeding U.S. Treasuries by about 2 percentage points before friction costs), basis arbitrage traders cannot fully capture gross returns. ETF management fees, monthly roll costs, and margin costs that must be held at clearinghouses will consume more than half a percentage point, ultimately yielding only a net return about 1.5 percentage points higher than cash; in contrast, at the historical peak, the same arithmetic model could leave about 3 percentage points of excess net profit, with returns even higher when the near-month contract annualized at 9.8%.
Once the spot long side leverages financing rates (SOFR) with a spread, the additional returns that leverage can bring are minimal, and the thin residual spread cannot compensate for potential tail risks: for example, in December 2022, the CME basis deeply inverted to an annualized -31% (Figure 7). It is this arithmetic reversal of returns and risks that has prompted multi-strategy hedge funds to exit, rather than the volatility of the price itself.
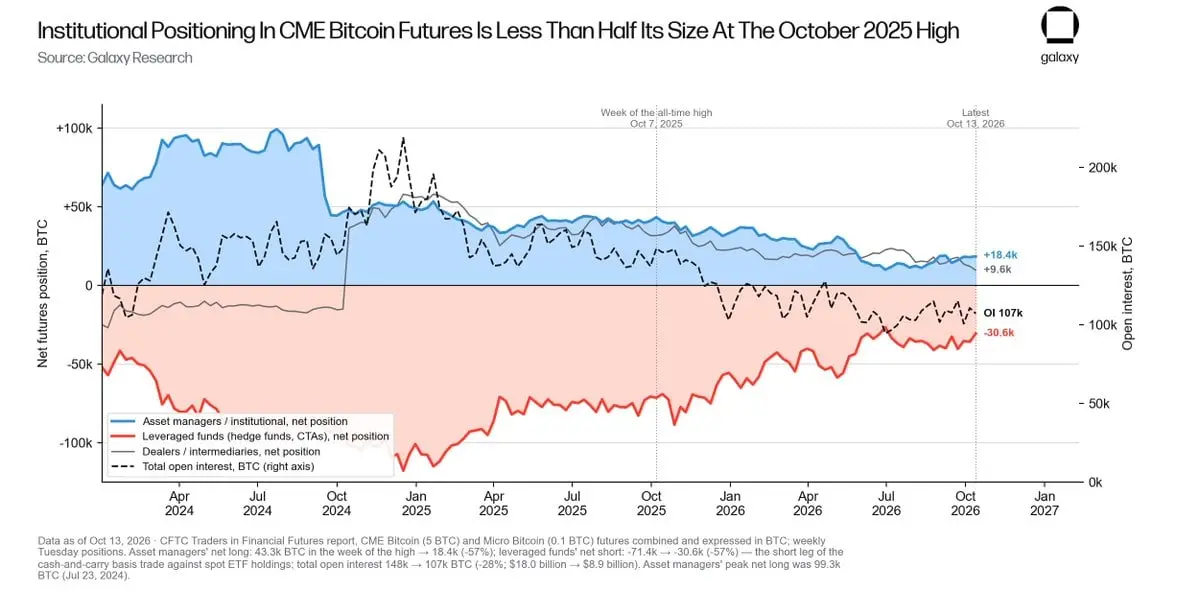
Figure 6: Net positions in CME Bitcoin futures categorized by trader groups (units: BTC). The net long position of asset management institutions has decreased by 57% from the historical peak week, and the net short position of leveraged funds has also decreased by 57%; open interest measured in BTC has dropped by 28%, while measured in USD it has decreased by 51%.
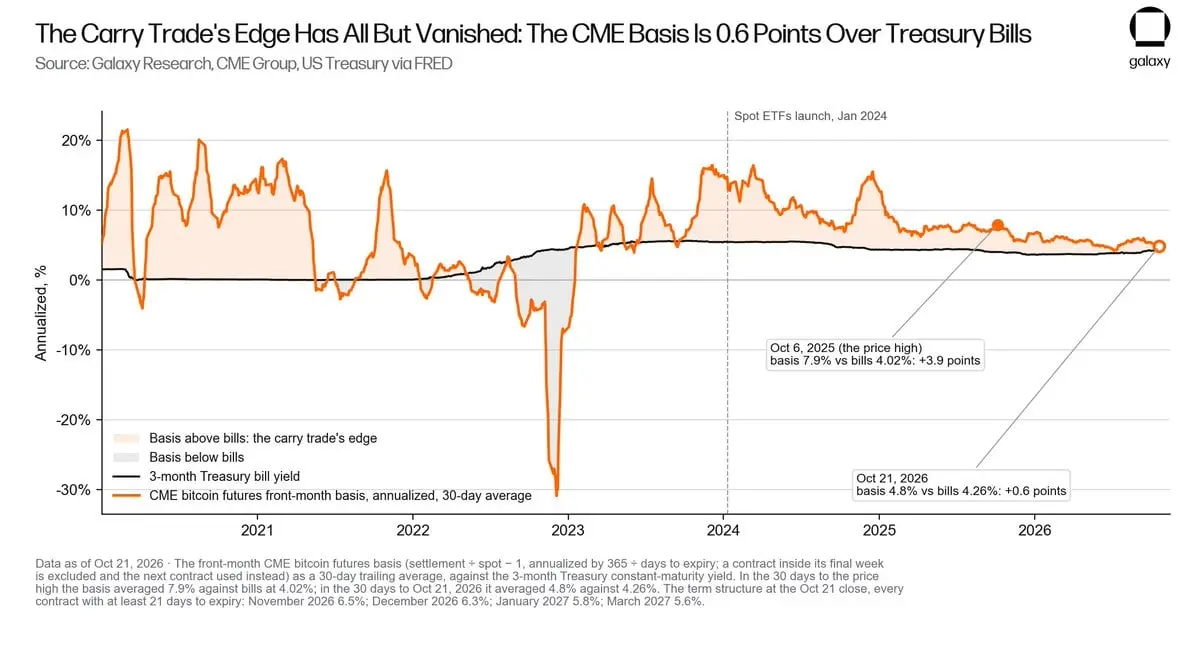
Figure 7: The trend of CME near-month basis (30-day annualized average) relative to the 3-month U.S. Treasury yield since 2020; the shaded area represents the excess return space of basis arbitrage compared to U.S. Treasuries. In the 30 days before the peak, the basis exceeded U.S. Treasuries by 3.9 percentage points; in the 30 days ending October 21, it was only 0.6 percentage points higher.
The 13F quarterly filing data from investment institutions reveals the true picture of institutional sellers, most of whom are basis arbitrageurs and macro transient funds. As of September 30, 2025 (the last quarter before hitting the historical peak), the reporting institutions collectively held the equivalent of 355,000 BTC in spot ETF shares, which dropped to 307,000 BTC by June 2026 (a decrease of -14%). The reduction in holdings almost entirely came from multi-strategy funds, macro hedge funds, basis proprietary trading desks, and investment bank trading accounts that used ETFs for arbitrage and momentum trading. The reduction among nine institutions, including Millennium Management, Brevan Howard, Goldman Sachs Group, Capula Management, Farallon Capital, D. E. Shaw, Schonfeld Strategic Advisors, Symmetry Investments, and Tudor Investment Corp, ranged from 29% to 100%, totaling a reduction of 68,000 BTC.
This figure even exceeds the total net decrease of 48,000 BTC among all 2,200 reporting institutions in the U.S., indicating that all other reporting institutions are in a net accumulation state overall (Table 8). Wealth management platforms and sovereign wealth funds have absorbed the chips sold by speculative transients (Morgan Stanley Wealth Management, Mubadala Investment Company, and Abu Dhabi Investment Authority have all increased their holdings; Horizon Kinetics has chosen to hold firm); meanwhile, against the backdrop of a 49% drop in price, the non-reporting base holdings composed of advisory institutions, family offices, and high-net-worth individuals have only slightly decreased by 6.6% (Figure 9).
From peak to trough, the total holdings of spot ETFs in the market have only shrunk by 11%, while the price has dropped by 53% during the same period; since the low in June, ETFs have net increased their holdings by 87,000 BTC, while the short positions of leveraged funds continue to decline. This capital flow clearly shows characteristics of directional long buying rather than futures arbitrage funds (Figure 10).
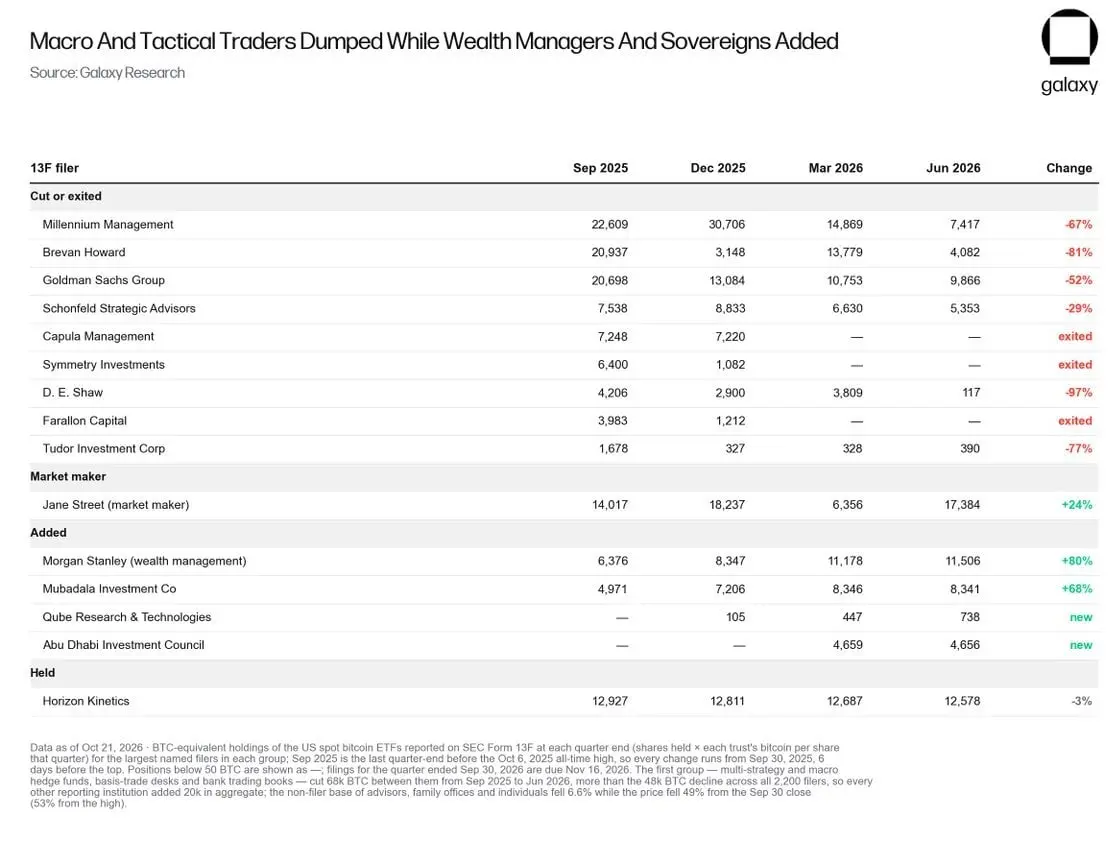
Table 8: Position changes of well-known 13F reporting institutions from the end of the third quarter of 2025 to June 2026. The nine large hedge funds in the first group collectively reduced their holdings by 68,000 BTC, exceeding the total decrease of 48,000 BTC among all reporting institutions, indicating that all other reporting institutions have overall net increased their holdings by 20,000 BTC.
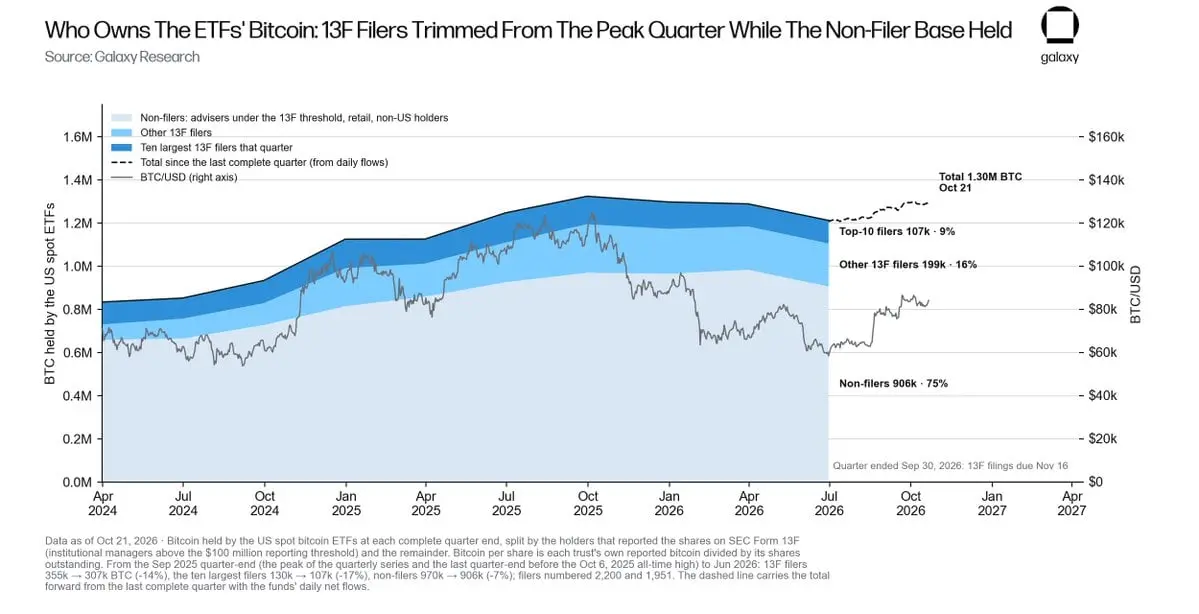
Figure 9: The total amount of Bitcoin held by U.S. spot ETFs at the end of each complete quarter (distinguished between 13F reporting institutions and other holders). From the end of the third quarter of 2025 to June 2026, the holdings of 13F reporting institutions decreased by 14%, and the top 10 reporting institutions reduced their holdings by 17%; meanwhile, during the 49% drop in price, the non-reporting base holdings only decreased by 6.6%.
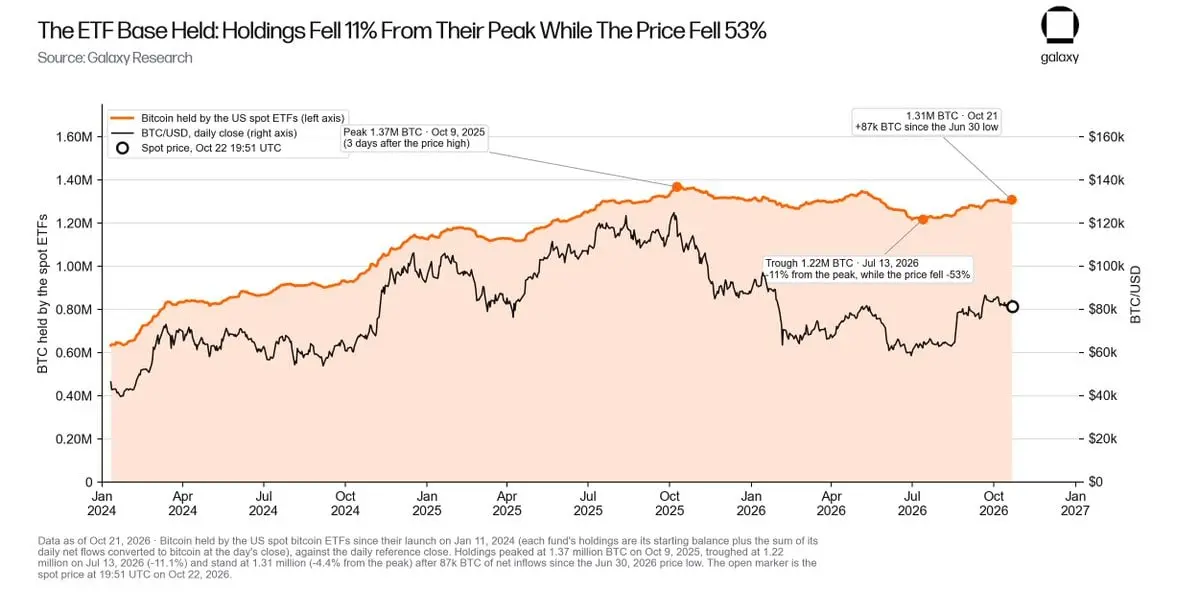
Figure 10: Comparison of Bitcoin holdings and price trends since the launch of U.S. spot ETFs. From the peak on October 9, 2025, to the trough on July 13, ETF holdings only decreased by 11%, while the price plummeted by 53%; since the low in June, ETF holdings have increased again by 87,000 BTC.
This explains why most panic events this year have not triggered large-scale sell-offs of Bitcoin, while also forming a highly attractive relative value logic. Currently, the S&P 500 index is only 0.8% away from the historical peak set on October 6, the Nasdaq 100 index is only 4.5% away from its peak, while gold has dropped 22% from its January high. Based on Thursday's closing price, Bitcoin is 35% lower than its historical peak, meaning it only needs to rise 53% to return to the trading price range of a year ago (Figure 11).
The only alternative to all these risk assets is cash. Choosing to short stocks and hard assets now is akin to betting on fiat currency; however, the issuers of fiat currency have long announced to the world through an annual fiscal deficit of $2 trillion and a 10-year U.S. Treasury yield of up to 5% that fiat currency will inevitably be continuously diluted. This is precisely the only investment stance that has no foothold in the current global macro environment.
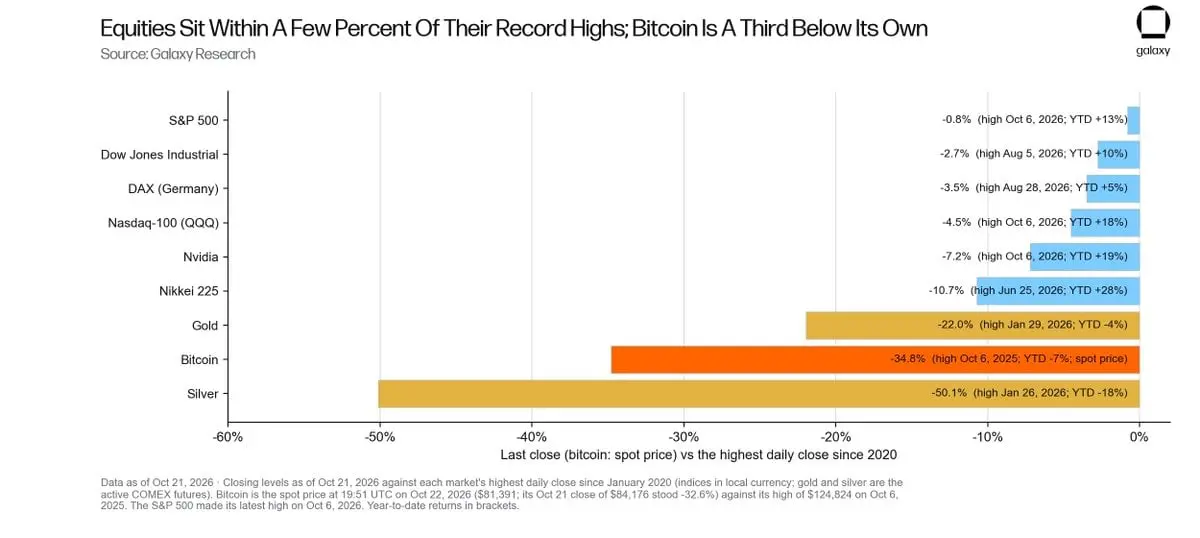
Figure 11: Comparison of the latest closing prices in major markets relative to the highest closing prices since 2020 (Bitcoin is based on the spot price of $81,391 as of October 22, 19:51 UTC). The S&P 500 index is only 0.8% away from the historical high set on October 6; Bitcoin is still 35% below its all-time high, with a recovery potential of 53%.
Fundamental Logic: The Logic of Fiat Currency Depreciation is Stronger than at Historical Highs
As of October 20, 2026, the scale of U.S. federal government debt has risen to $40.44 trillion, a significant expansion from $23.2 trillion at the beginning of 2020; the fiscal year 2026 ended with a massive deficit of $1.99 trillion, accounting for 6.2% of GDP, and the government's annual interest expenditure has reached $1.28 trillion (Figure 12).
The bond market has begun to demand risk compensation for this: On October 5, 2026, the yield on 10-year U.S. Treasury bonds reached 5.31%, the highest level since 2007. Faced with a CPI inflation rate of 3.7% and an M2 growth rate of 5.7%, the Federal Reserve was forced to raise the benchmark interest rate to 3.75% to 4.00% on September 16, 2026. A sovereign government maintaining a deficit equivalent to 6% of GDP while refinancing $40 trillion in debt at a cost of 5% faces increasing pressure to dilute its debt through inflation, and historical trajectories repeatedly point to this outcome. Every time systemic liquidity is under pressure, it ultimately forces central banks to play the role of the ultimate buyer, as seen during the 2020 pandemic crisis and the banking crisis in March 2023.
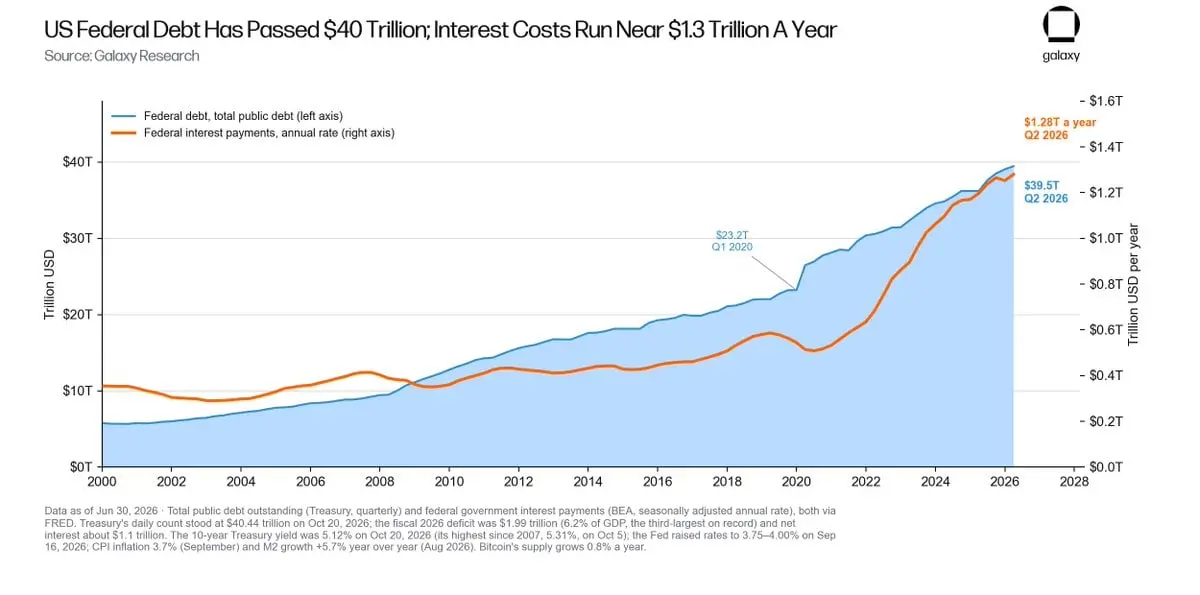
Figure 12: Trends in U.S. federal total debt and annual federal interest expenditure since 2000. Since the beginning of 2020, federal interest expenditure has surged to 2.4 times its original amount.
The global artificial intelligence (AI) infrastructure arms race, often seen as competing for capital with Bitcoin, is essentially a powerful currency depreciation machine: Morgan Stanley predicts that debt issuance related to AI will reach $570 billion in 2026, and about $1.5 trillion of infrastructure construction by 2028 must rely on external financing support. If these massive investments yield the expected returns, they will have undergone significant credit expansion; if the investments ultimately fail to recoup costs, the debt losses will inevitably be socialized through the system. In any scenario, the future supply of credit certificates for wealth claims is expanding significantly, which in turn will further elevate the intrinsic value of non-sovereign hard currency assets with a constant issuance volume.
The second core fundamental logic is more enduring than any interest rate cycle: as the technological capability to monitor, freeze, or rewrite the flow of funds continues to strengthen, the demand for currency that cannot be frozen, monitored, or tampered with will rise in tandem, while AI technology makes the cost of implementing such comprehensive surveillance extremely low. Whether tokenized bank deposits or centralized stablecoins, they have the attribute of being able to be frozen at any time from the moment of system design; Bitcoin is currently the only large-scale, bearer asset in the world without any centralized issuing entity. As the global financial system accelerates towards programmable currency and a comprehensive surveillance era, the demand for ultimate safe-haven assets only increases.
Market Sentiment Cycle: The Sentiment Pendulum Swings for the Third Time Towards "Want Blockchain, Not Bitcoin"
In past cycles, mainstream traditional finance has enthusiastically embraced underlying technology twice, while scoffing at Bitcoin itself.
Between 2015 and 2016, the R3 alliance formed by major international banks and the famous "Trust Machine" cover article by The Economist made "Want Blockchain, Not Bitcoin" the most respectable consensus position among financial elites. At that time, Bitcoin's weekly lowest closing price was only $231, while the subsequent bull market peak was 83 times higher.
Between 2018 and 2019, market sentiment shifted to "Want Blockchain, Not Cryptocurrency." JPMorgan's JPM Coin and Facebook's Libra project made high-profile appearances, while Bitcoin was seen as on the verge of death, having fallen to a desperate low of $3,195. However, the subsequent bull market peak was 20 times higher than this bottom.
The new version in 2026 has turned into "Want Stablecoins and Tokenization, Not Bitcoin": mainstream banks are intensively piloting tokenized deposits, the CLARITY Act was blocked in the motion to end debate on September 15, and generative AI has almost monopolized the growth narrative across the market. Historical patterns indicate that whenever the sentiment pendulum swings so drastically, Bitcoin often finds itself within a year of the cycle's low point (Figure 13).
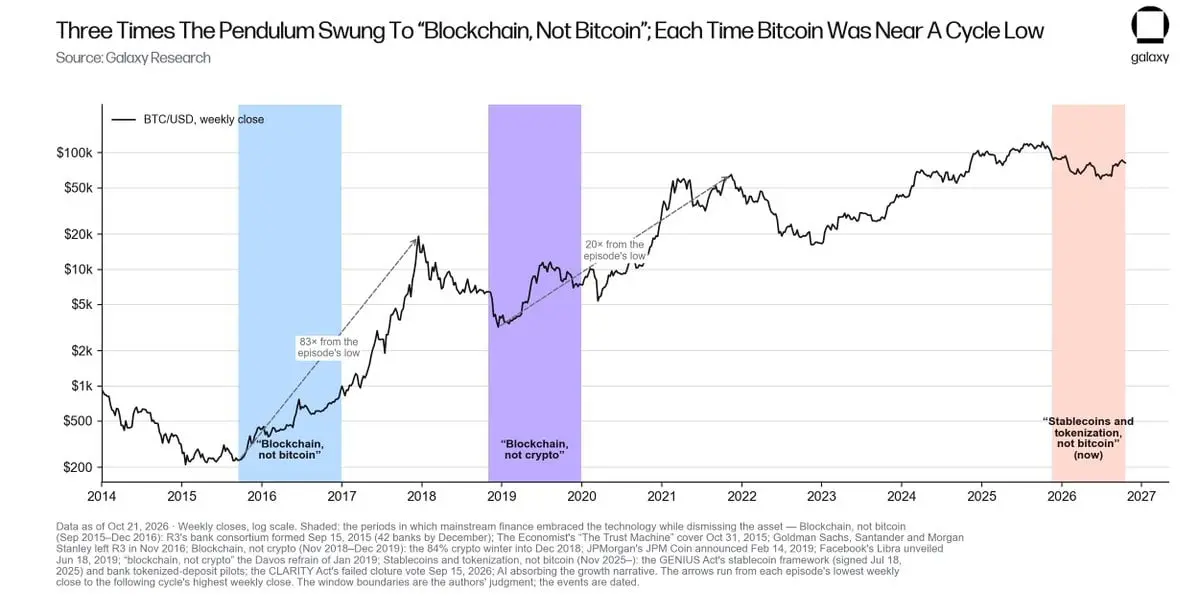
Figure 13: Weekly price performance during historical periods when mainstream financial institutions embraced technology but abandoned native assets. In the lows of the previous two cycles, Bitcoin subsequently recorded peaks that were 83 times and 20 times higher than the bottoms, respectively.
The shift in 2026 is vividly reflected in on-chain data. U.S. dollar liquidity has massively gone on-chain: since early 2024, the total circulating supply of stablecoins has surged by 129%, reaching a massive scale of $304 billion. Meanwhile, the core asset that these blockchain tracks were initially designed to carry and settle, Bitcoin, remains one-third lower than its historical high (Figure 14). This clearly indicates that a large amount of dry powder (waiting funds) is merely residing within the crypto ecosystem, waiting for the right opportunity, rather than permanently exiting the market.
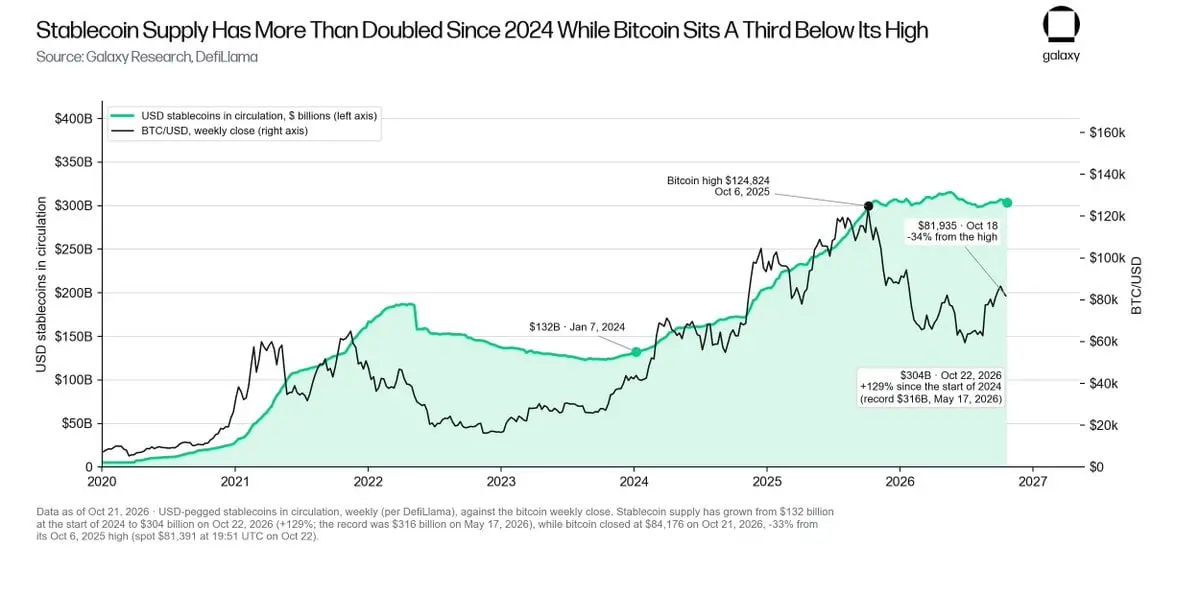
Figure 14: The circulation of U.S. dollar stablecoins (data source: DefiLlama) relative to Bitcoin's weekly closing price trends. Since early 2024, the supply of stablecoins has increased significantly by 129% to $304 billion, while Bitcoin's price is still 35% lower than its historical peak.
Network heat data further confirms the market's extreme neglect: On October 13, 2026, the Google search interest index for "Bitcoin" fell to a multi-year low; the fear and greed index (Alternative.me data), which peaked at 71 in October 2025, dropped to an extreme low of 5 in February 2026, and at the bottom in June, the reading was only 15; net fund flows for spot ETFs this month have almost stagnated. However, in an environment of almost no market attention, Bitcoin has quietly rebounded 39% from its bottom. This is a typical pre-bull market scenario that is widely overlooked, with institutions under-allocated but steadily building momentum.
Potential Risks and Mitigation Mechanisms
Retracement Risk: Bitcoin could further decline at any time. If the global traditional financial market experiences a significant downturn (for example, due to anxiety over an AI bubble burst or sudden geopolitical conflicts), Bitcoin may also face liquidity tightening and retracement resistance.
Mitigation Mechanism: In the four cases where the price recovered the 50-week moving average after experiencing long-term breaks, the subsequent worst weekly closing price retracement has never exceeded -8.4% from the breakout level (Figure 2), and historically, each round of bear market retracement has been significantly smaller than the previous one (Figure 15).
Our risk warning trigger line is: if the weekly closing price falls below the 50-week moving average ($76,540, 6% lower than yesterday's spot price) again and fails to recover within a month, it indicates that the moving average recovery pattern has failed. Additionally, the extremely low exposure of macro speculative funds in BTC will significantly reduce the collateral impact on Bitcoin during traditional risk asset retracements.
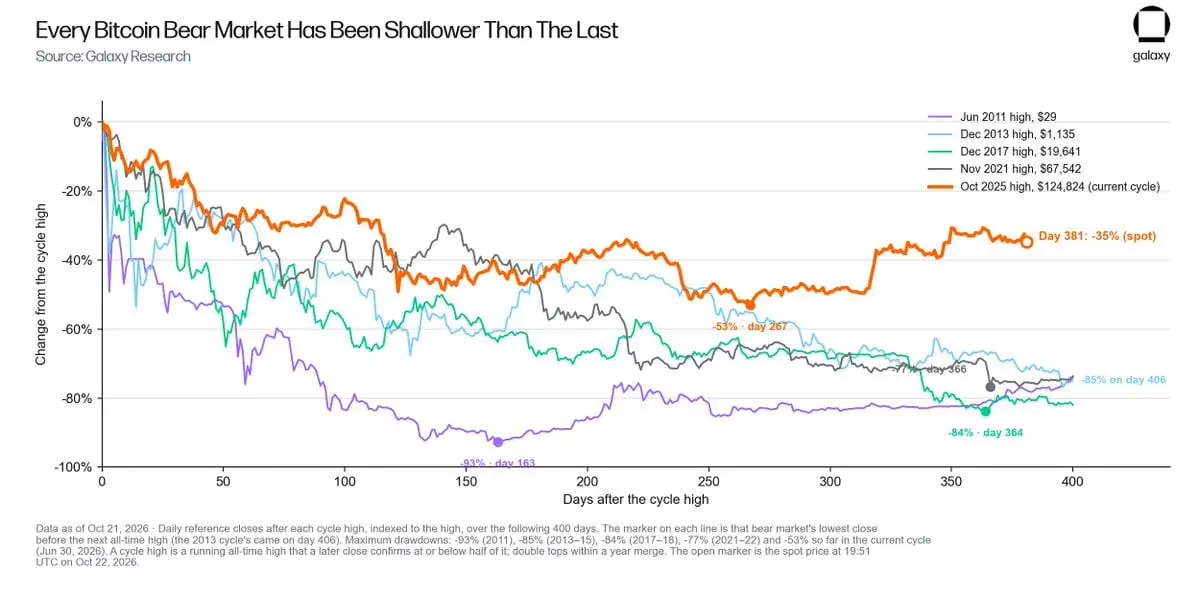
Figure 15: The retracement magnitude from historical highs across various cycles (lasting 400 days). The maximum retracement of 53% in this cycle is the shallowest on record; on day 381, the spot price retracement narrowed to -35% from the historical high.
AI Risk: I believe AI poses three potential risk transmission paths to the industry:
First, capital siphoning competition (the Nasdaq 100 index rose 18% this year, while Bitcoin fell 7% during the same period);
Second, AI-enabled automated hacking attacks and advanced social engineering scams (the total amount of stolen cryptocurrency assets reached $3.4 billion in 2025, with approximately $1.1 billion to $1.3 billion stolen in the third quarter of 2026, including a $387.5 million attack on Bitget, theft of about $91 million through a backdoor planted in Ledger hardware wallet distribution channels, and the theft of 1,837 BTC from 9,218 addresses using Coldcard mnemonic entropy vulnerabilities);
Third, macro risk asset liquidity sell-offs triggered by an AI bubble burst.
Mitigation Mechanism: None of the aforementioned security incidents have touched the underlying protocol security of Bitcoin; the damage is limited to centralized exchanges, third-party supply chain vendors, hardware terminal devices, or the end users themselves;
AI infrastructure construction heavily relies on debt financing and government tax subsidies (approximately $570 billion in AI-related bonds were issued this year, and the tax policy implemented since July 2025 allows full cost accounting for server and chip procurement in the year of purchase, which is estimated to create a fiscal gap of $363 billion over ten years), further exacerbating the federal deficit and making total constant assets more precious;
Moreover, AI has not weakened the mathematical foundations of the SHA-256 hash algorithm or the elliptic curve digital signature algorithm. Even if an AI investment bubble burst leads to market pressure, it will ultimately force the Federal Reserve to reopen liquidity, which precisely validates and reinforces the fundamental logic of Bitcoin rather than negating it.
Quantum Computing Risk: Currently, there are 7.1 million BTC (accounting for 35% of the total supply) stored in UTXO outputs where public keys have been directly exposed on-chain (Figure 16).
However, in reality, there are currently no quantum computers with practical cryptographic threat capabilities (CRQC): the largest elliptic curve key successfully cracked on quantum hardware is only 15 bits, while Bitcoin uses 256-bit encryption strength; Google's most advanced quantum chip has only 105 physical qubits, far from the 500,000 physical qubits required for cracking as pointed out in its own academic paper in March 2026.
Galaxy Research's special report titled "Bitcoin is Calmly Facing Quantum Readiness Challenges," released in March 2026, clearly states: "Quantum risk is real and has been fully recognized by the industry, and top experts who are best at solving this issue are fully advancing the response work." Relevant defensive developments have already received ample special funding support:
The output type specification BIP-360, which has quantum-resistant characteristics, was officially merged in February 2026; the Bitcoin Quantum Readiness Initiative Fund established by Galaxy has committed to invest up to $5 million; and the Bitcoin Security Alliance, composed of nine industry organizations (including Galaxy), has pledged to provide $15 million in funding support over three years. Every traditional bank and financial institution globally faces the same countdown to quantum upgrades in their underlying cryptographic systems, and Bitcoin's quantum-resistant migration plan is likely to become the world's most advanced and well-funded model.
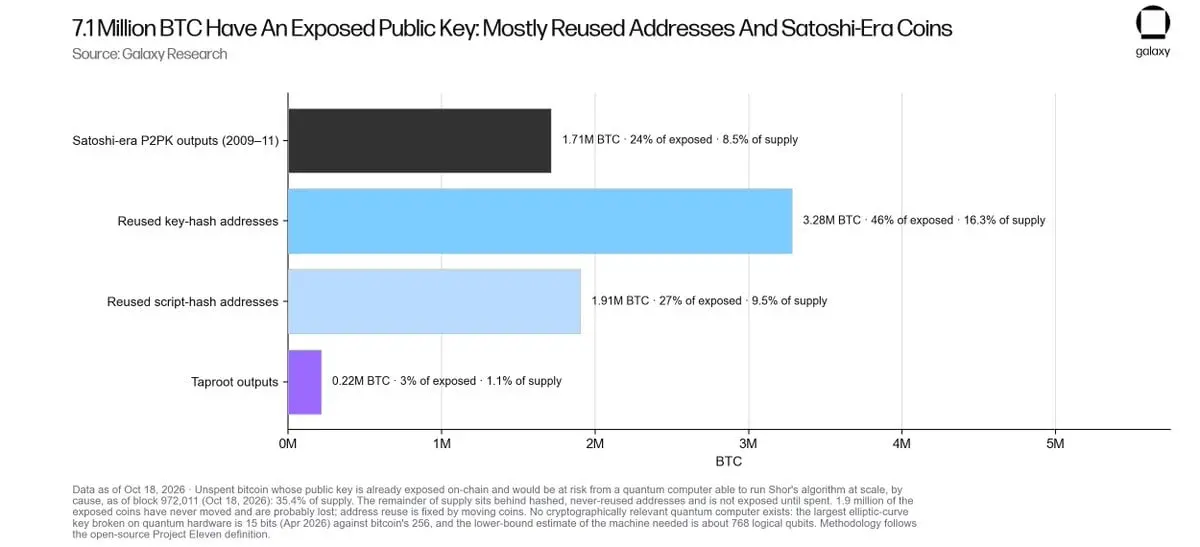
Figure 16: Unspent Bitcoins with public keys disclosed on-chain (classified by source). A total of 7.1 million BTC (accounting for 35.4% of the total supply) have exposed public keys, of which 1.7 million belong to Satoshi Nakamoto's early Pay-to-Public-Key (P2PK) outputs.
What Signals Could Overturn Our Bullish View
Potential signals that could overturn our bullish stance include: the weekly closing price falling below the 50-week moving average ($76,540) and failing to recover within a month; the total holdings of the national spot ETF falling below the low of 1.22 million BTC set on July 13; the emergence of a practical quantum computing roadmap with a clear timeline and credible decryption capabilities; or a sudden substantial fiscal consolidation and deficit reduction by the U.S. federal government. However, in the current reality, none of the above assumptions have shown even the slightest sign.
We firmly believe that the market cycle bottom has been established, the selling pressure from multiple parties has significantly exhausted, the fundamental logic of macro monetary depreciation is stronger than ever, and the restless and blind speculators have largely exited the market. All of this is the basis for our strong bullish outlook on Bitcoin's future.
Bitcoin has already fully proven its ability to surge to at least $125,000, and we have no reason to doubt that it cannot reclaim this price peak. In fact, the current overall technical and macro landscape is extremely favorable.
Alex Thorn, Head of Global Research at Galaxy
New York
October 22, 2026